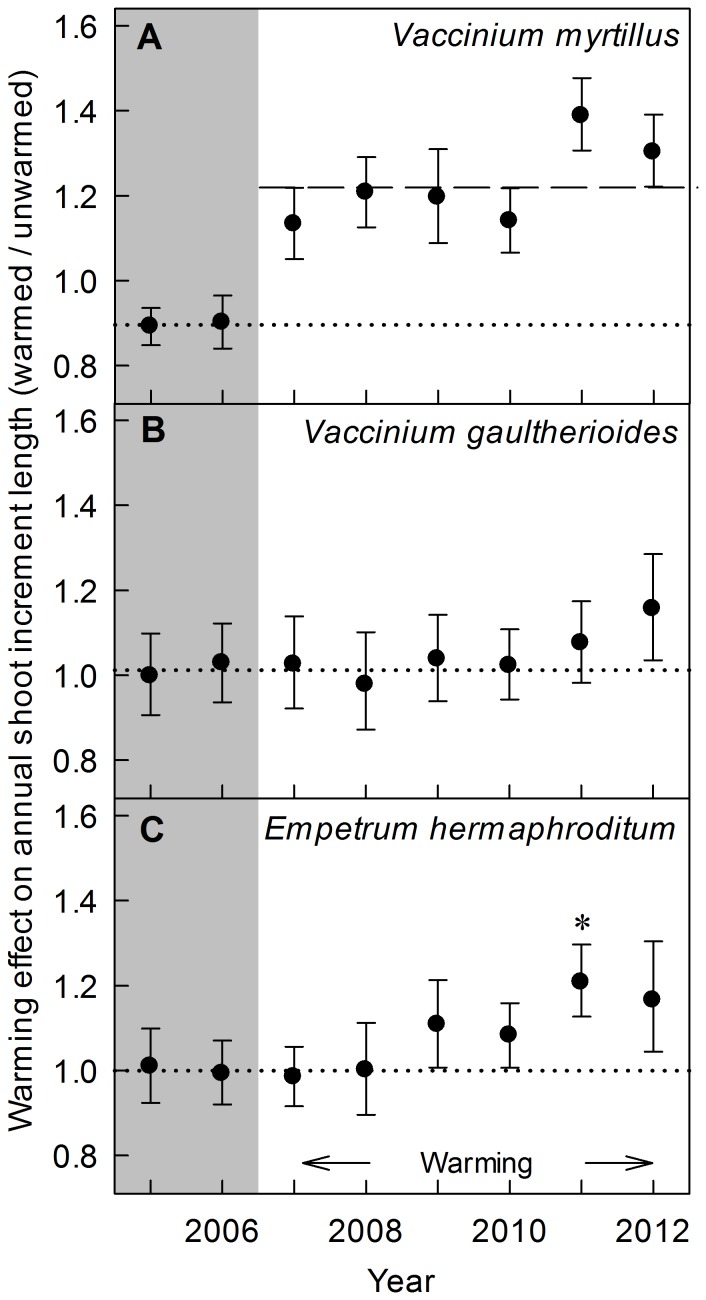
Figure 2. Soil warming effect on dwarf shrub annual shoot increment length.
Soil warming effect on dwarf shrub annual shoot increment length from 2007 until 2012, the entire duration of the soil warming experiment. Data through 2009 were presented in Dawes et al. (2011a). The warming effect was calculated as the ratio of the mean shoot increment length of all warmed plots to the mean of all unwarmed plots, pooled across plots containing a larch or pine tree. Error bars represent ±1 SE of the ratio. The dashed line shows the significant warming effect on V. myrtillus averaged for 2007–2012. The asterisk shows significant differences between temperature treatments (P<0.05). Pre-warming ratios are shown in the shaded region (2005–2006) and the dotted line is drawn through the average of these two points, which indicates the mean warmed to unwarmed ratio before treatment began.

