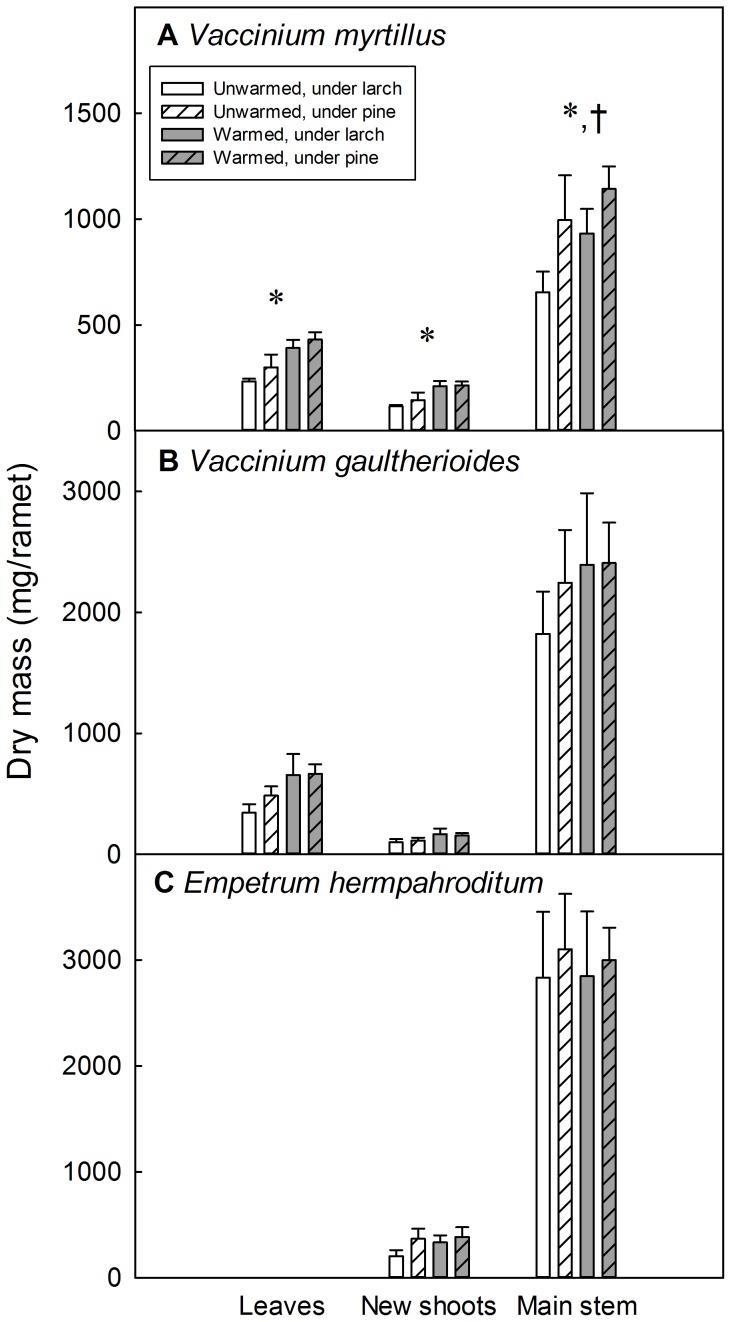
Figure 3. Above-ground biomass partitioning of the three dwarf shrub species studied.
Above-ground biomass partitioning of the study species for each soil warming and plot trees species combination (mean values +1 SE, n = 10). Asterisks show significant differences between soil warming treatments and crosses show significant differences between plot tree species (P<0.05). For Empetrum hermaphroditum only, leaves and new shoots are both included in “New shoots”. The y-axis scale varies across species to emphasize differences between treatments.

