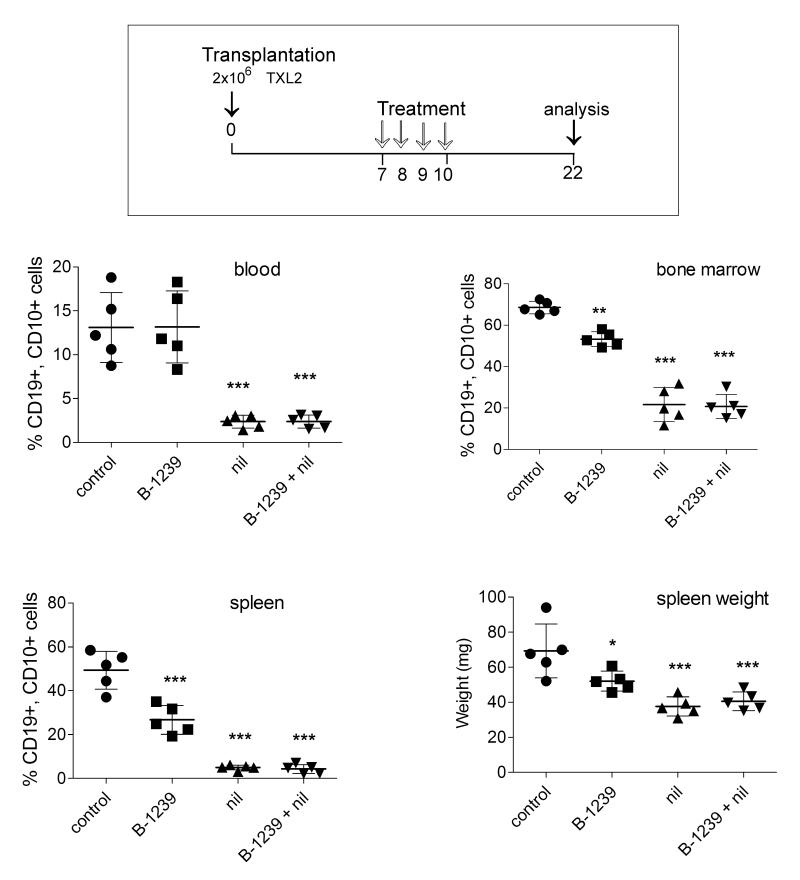
Figure 6.
Treatment of mice with B-1239. Top, Schematic of in vivo treatment with 10 mg/kg B-1239, control 10 mg/kg human IgG or combined with 75 mg/kg nilotinib. Bottom, Percentage of human CD19+ CD10+ ALL cells as detected by FACS in blood, bone marrow and spleen of NSG leukemic mice and spleen weights of control and treated mice on d22. *p<0.05, **p<0.01, ***p<0.001; all comparisons with control. Nil versus nil+ B-1239, n.s. One of two independently performed experiments.

