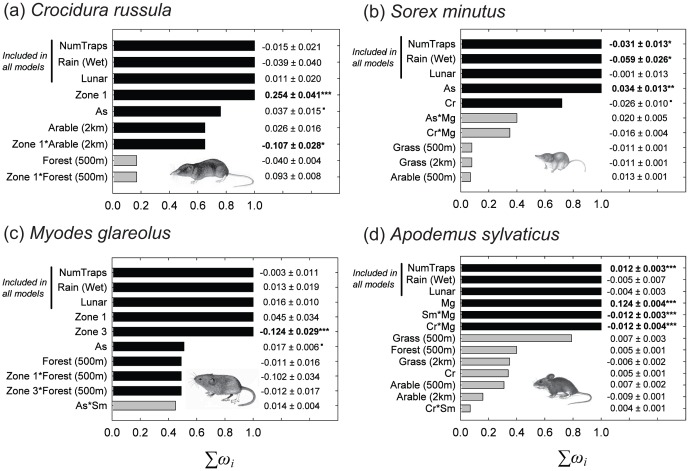
Figure 4. The model averaged terms (from selected models with ΔAICc≤2) for models of the abundance of (a) Crocidura russula (Cr) (b) Sorex minutus (Sm) (c) Myodes glareolus (Mg) and (d) Apodemus sylvaticus (As).
Bars show the relative importance of each term (ranked in order of the sum of their Akaike weights, Σωi). Black bars indicate terms in the best-approximating model (ΔAICc = 0). NumTraps, Rain and Lunar were included in all models to control for confounding influences. Standardized regression coefficients (β) ±1 standard error (SE) are shown to the right of each bar. Significance levels from the best-approximating model are indicated as • p<0.1, * p<0.05, ** p<0.01 and *** p<0.001, and significant terms at p<0.05 are shown in bold. The R2 values of observed versus fitted values for each best approximating model are 0.53, 0.22, 0.28 and 0.90 for C. russula, S. minutus, M. glareolus and A. sylvaticus, respectively.

