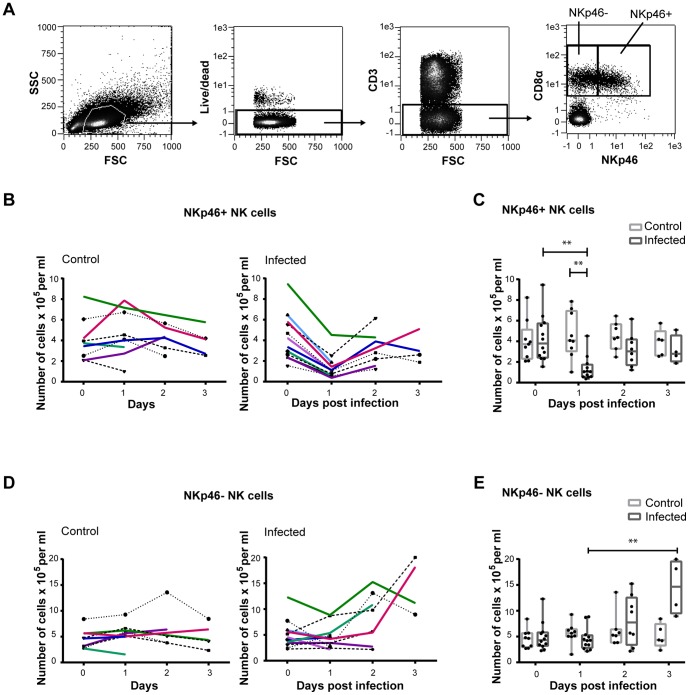
Figure 2. NK cell numbers in the blood of influenza infected pigs.
Blood was taken from influenza A virus infected (n = 12) and control pigs (n = 9) on day 0−3 pi in a second experiment. (A) Isolated PBMCs were analysed by flow cytometry and live CD3− lymphocytes were gated as NKp46− or NKp46+ NK cells according to CD8α and NKp46 expression. Plots are taken from a representative control animal. Absolute numbers of (B) NKp46+ NK cells in PBMC were analysed by flow cytometry in control (left) and infected animals (right). (C) Results for the NKp46+ cells in the two groups were compared on each sampling day. (D) NKp46− NK cells in PBMC in control (left) and infected animals (right). (E) NKp46− NK cells were compared for the two groups. Each line in (B) and (D) represents one animal. **p≤0.01.

