
Figure 2. Effect of betaine on lactic acid fermentation under different concentrations of glucose.
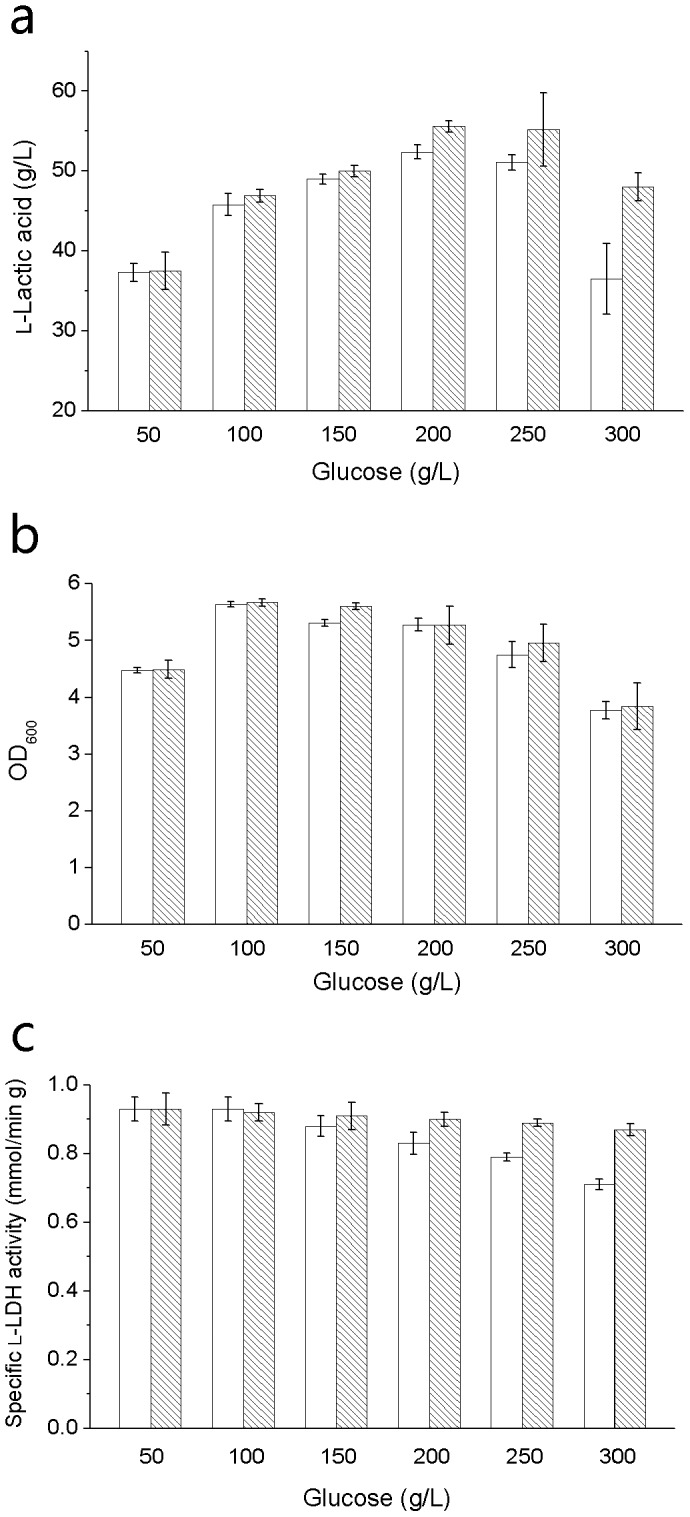
(a) l-Lactic acid concentration obtained in fermentation. (b) Cell density determined at 600 nm in fermentation. (c) Specific l-LDH activity in fermentation. The blank column represents for fermentation without betaine. The stripe column represents for fermentation with 0.05 g/L betaine. The error bars indicate the standard deviations of three parallel replicates.