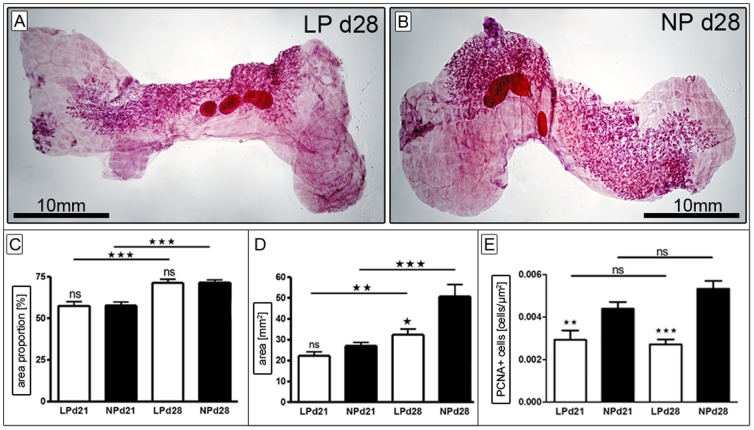
Figure 2. Analysis of ductal morphogenesis.
A+B) Exemplary transmitted light microscope images of lumbar mammary gland whole mount preparations at day 28 of LP (A) and NP (B). Magnification is indicated by the black bar (10 mm). The percentage of lumbar mammary fat pad occupied by ducto-alveolar structures (“area proportion” in %, C), as well as the area (mm2) occupied by ducto-alveolar structures itself (D) were examined at day 21 (LP n = 13, NP n = 18) and day 28 (LP n = 12, NP n = 10). Furthermore the rate of proliferation was determined immunohistochemically in terminal end buds (TEB) via PCNA-stain (E, see also Figure S1), with LP d21 (n = 6), LP d28 (n = 10), and NP d21 (n = 7), NP d28 (n = 9). LP = low protein (white bars); NP = normal protein (black bars); d = day; * = p<0.05, ** = p<0.01; *** = p<0.001; ns = not significant.

