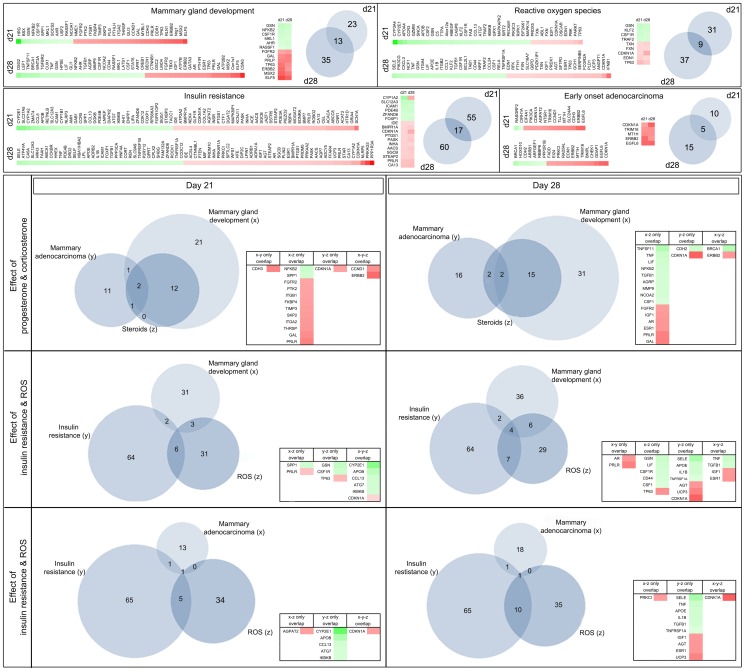
Figure 4. BioVenn diagram analysis of functional gene clusters: Displayed are the results of the comparative analysis of differentially regulated genes using IPA Ingenuity software and consecutive Venn diagram transformation.
The upper section lists differentially regulated genes of the generic networks mammary gland development, reactive oxygen species (ROS), insulin resistance and early mammary adenocarcinoma at day 21 and day 28 as heatmaps. The lower section displays overlapping genes of these generic networks as Venn Diagrams at day 21 (on the left) and day 28 (on the right). The quantity of regulated genes of each network cluster is indicated in the respective small Venn diagrams by number. In the upper section, common genes that are differentially regulated at both day 21 and day 28 are represented by the amount of overlap of the circles and listed in the small table next to the diagram. In contrast, the tables in the lower section of this figure display overlapping genes of three selected pathways as indicated. Red = up-regulated gene; green = down-regulated gene; white = fold-change value of 0.

