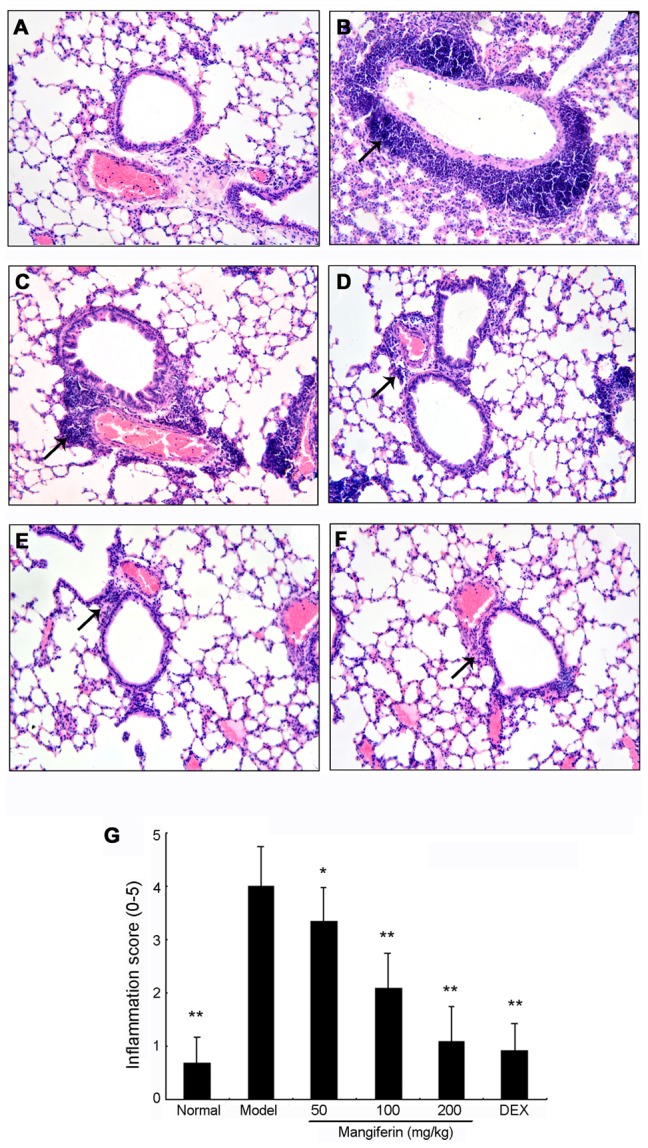
Figure 3. Effects of mangiferin on OVA-induced lung histological changes in experimental mice.

(A) Normal; (B) Model; (C) Mangiferin 50 mg/kg, (D) Mangiferin 100 mg/kg, (E) Mangiferin 200 mg/kg, (F) Dexamethasone 1.25 mg/kg, (G) Qualitative analysis of anti-inflammatory effects of mangiferin based on inflammation scores as described in Materials and Methods. H&E staining, magnification 200×, only a representative picture is shown for each group. Twelve mice have been used in each group and all in vivo experiments were repeated for three times. Data are expressed as means ± SDs. Compared with model group: * P<0.05; ** P<0.01.
