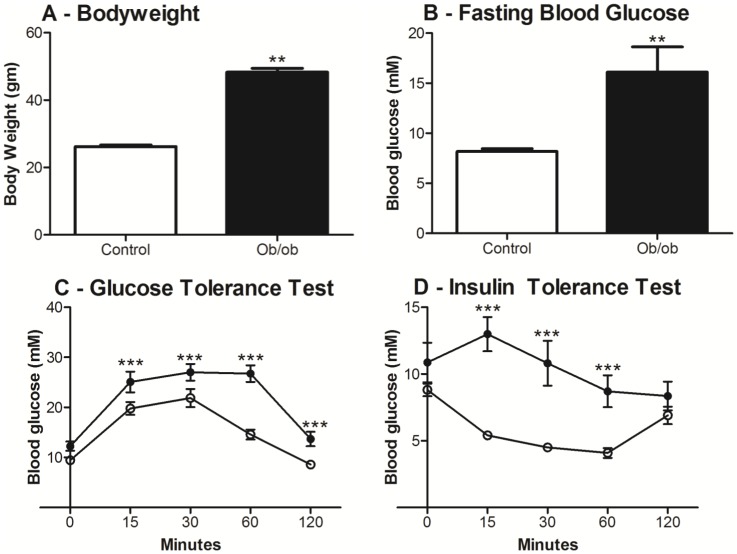
Figure 1. Body weight, fasting blood glucose, glucose tolerance test (GTT) and insulin tolerance test (ITT) of ten-week old ob/ob and lean mice.
Ob/ob mice were significantly heavier (A) with significantly higher fasting blood glucose (B) than lean mice. GTT (C) and ITT (D) were performed after 12–13 hours of fasting. Compared to lean mice, ob/ob mice displayed glucose intolerance and insulin resistance. Data are shown as mean ± SEM (n = 9 mice/group; ob/ob, closed bar/closed circle; lean mice, open bar/open circle). Analyses were performed using Students t-tests for body weight and fasting blood glucose; and two-way ANOVA for GTT and ITT. **, P<0.01; ***, P<0.001.

