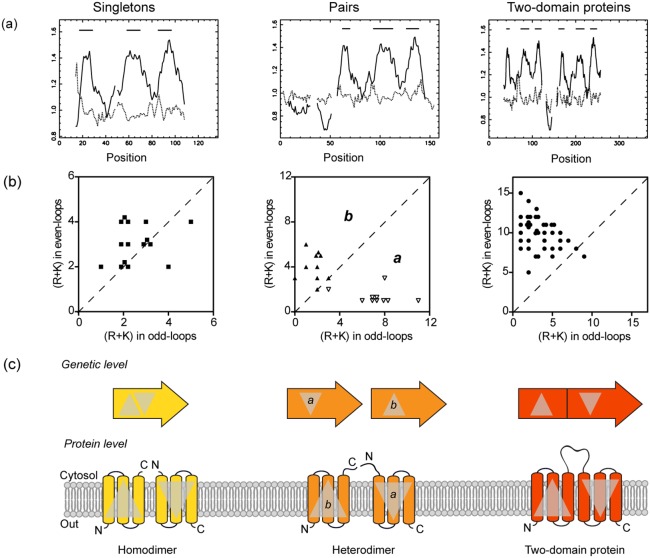
Figure 2. Illustration of the evolutionary intermediates found among prokaryotic UPF0016 members.
(a) Topology of each subgroup predicted using TMAP based on multiple alignments obtained with the Muscle algorithm. A plot of the propensities to form the middle (plain line) or the end (dotted line) of the transmembrane regions is given; bars are displayed in the plots above the regions predicted to form transmembrane spans. (b) Distribution of positive charges (R+K) in the odd-loops (same side of the membrane as the N-terminus) plotted against the distribution of positive charges in the even-loops. Singletons (▪), pairs a (▿), pairs b (▴), and fusions (•). (c) Model of organization, at the genetic and protein levels, of the prokaryotic UPF0016 members. Inspired from [12].

