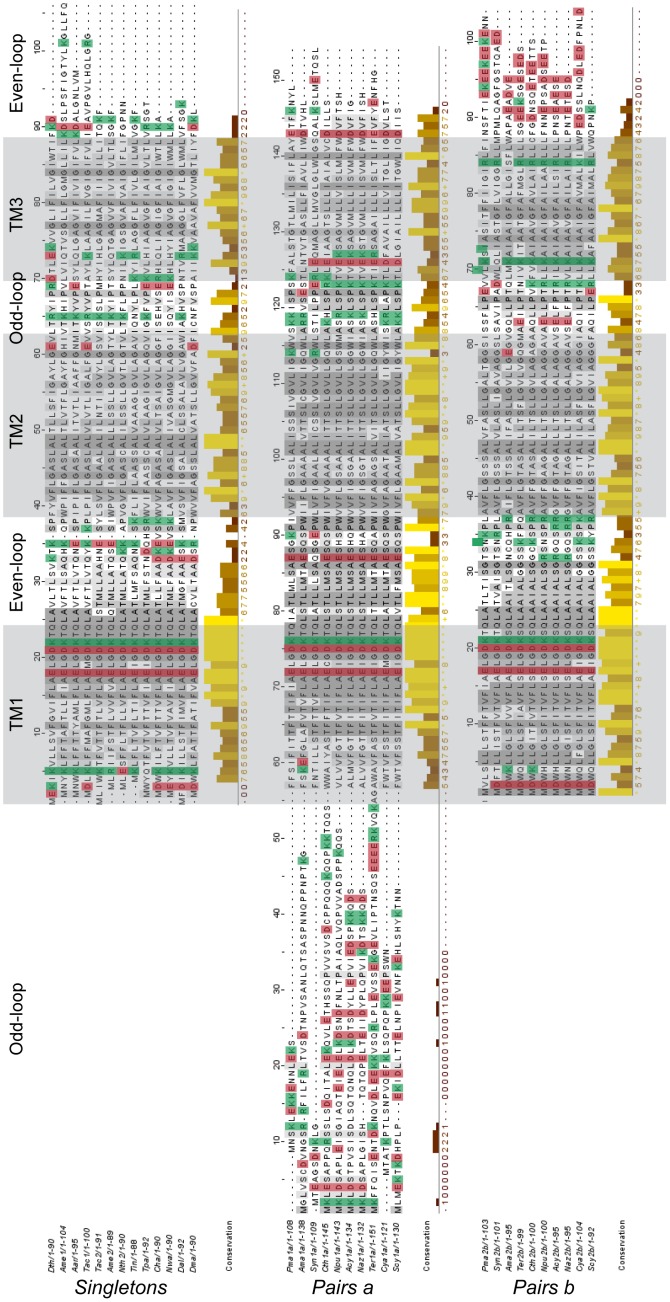
Figure 3. Repartition of the positive and negative charges within the products of prokaryotic singletons and paired genes.
The sequences were aligned with the Muscle algorithm and the transmembrane domains predicted using TMAP (shaded in grey). The resulting alignments were visualized with Jalview: the conservation histogram is a quantitative annotation which measures the number of conserved physico-chemical properties conserved for each column. All of the positively charged residues (K+R) are highlighted in green, and the negatively charged residues (D+E) in red.

