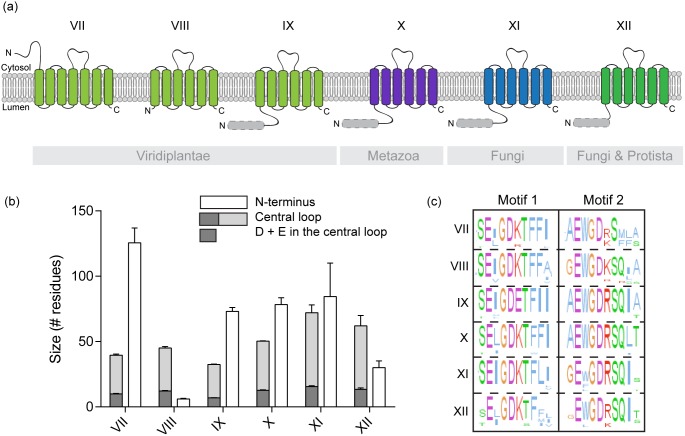
Figure 5. Comparison of the different eukaryotic subfamilies (VII to XII).
(a) Scheme of the consensus topology for each subfamily, obtained using TMHMM predictions for each sequence. Plant, metazoan, fungal, and protist/fungal subfamilies are colored in light green, purple, blue, and dark green, respectively. When predicted by SignalP 4.0 the signal peptides for most members of the subfamily are depicted as a pale grey dotted box.

