
Figure 5. Scatter plot comparing stage N3 (as a proportion of TST) measured with Mrec and Macc.
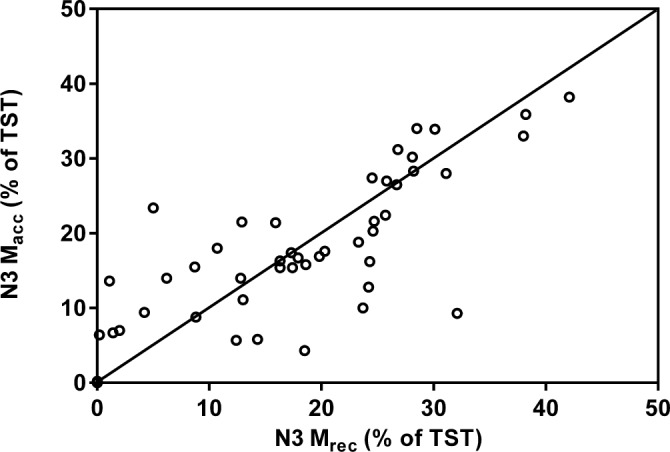
The diagonal line represents the line of identity. Correlation is significant at the 0.05 level.
Official websites use .gov
A
.gov website belongs to an official
government organization in the United States.
Secure .gov websites use HTTPS
A lock (
) or https:// means you've safely
connected to the .gov website. Share sensitive
information only on official, secure websites.
The diagonal line represents the line of identity. Correlation is significant at the 0.05 level.