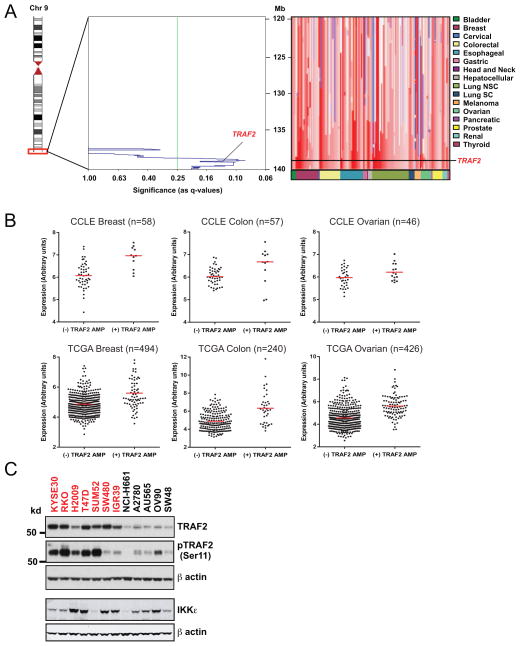
Figure 1. TRAF2 is amplified in human cancers.
(A) Copy number profiles at the 9q34 locus. Left panel, Significance of TRAF2 amplifications across 3131 cancer samples was determined by GISTIC (genomic identification of significant targets in cancer) and shown as q-values (false discovery rate corrected significance of amplification frequency). Right panel, copy number profiles for 50 cancer samples harboring TRAF2 amplifications. Genomic location and the TRAF2 locus are indicated on the vertical axis and lineages on the horizontal axis are denoted by color. Copy number gain and loss are indicated as red and blue signals respectively. (B) Scatterplots of TRAF2 mRNA expression in TRAF2 amplified or non-amplified primary breast, ovarian, and colon tumors in TCGA (33–35) and cell lines in CCLE (43). These data are log2-transformed signal intensities with the median of each sample set denoted by a red line. (C) Immunoblot of TRAF2 and Ser11 phosphorylated TRAF2, and IKKε in 9q34 amplified (red) and copy neutral (black) cell lines. β-actin is displayed as a loading control.

