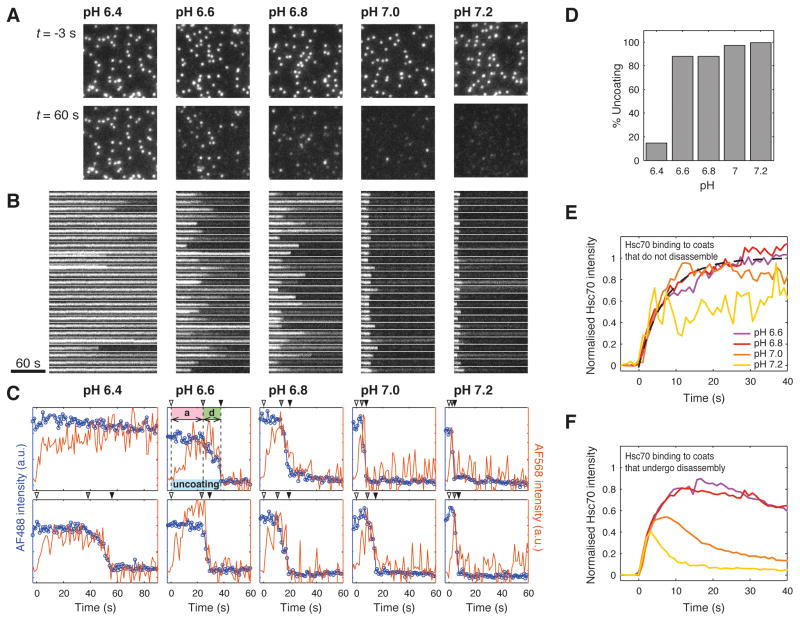
Figure 6. Single-particle uncoating assay at various pH values.
A. Frames of the uncoating time series (120×120 pixel region from a 512×512 pixel image) showing the diffraction-limited signals from AF-488 coats loaded with auxilin(547-910) before (top) and 60 s after addition of 1.0 μM Hsc70-ATP (bottom) at pH values between 6.4 and 7.2.
B. Kymographs of the clathrin signal originating from coats contained in the images shown in panel A.
C. Representative uncoating traces for clathrin/AP-2 coats showing binding of Hsc70 to the coats during the accumulation phase (“a”) followed by rapid coat disassembly (“d”). The arrow heads indicate the arrival of Hsc70-ATP (t = 0, open arrowhead), the start (grey arrowhead) and the end (black arrowhead) of the disassembly phase. The intensity trace of the clathrin signal is shown in blue and the intensity trace of the Hsc70 signal is shown in orange.
D. Uncoating efficiency of wild type clathrin/AP-2 coats between pH 6.4 and pH 7.2.
E/F. Hsc70 binding to the coats during the accumulation phase is not pH-dependent. The colored traces correspond to the average binding curves of Hsc70-ATP to coats in uncoating assays conducted between pH 6.6 and pH 7.2 for coats that remain intact (shown in F; average of N = 86, 93, 17, 3 traces for pH 6.6, 6.8, 7.0, 7.2, respectively) or those that undergo uncoating (shown in F; average of N = 624, 683, 617, 846 traces for pH 6.6, 6.8, 7.0, 7.2, respectively). The dotted line represents a fitted association curve.

