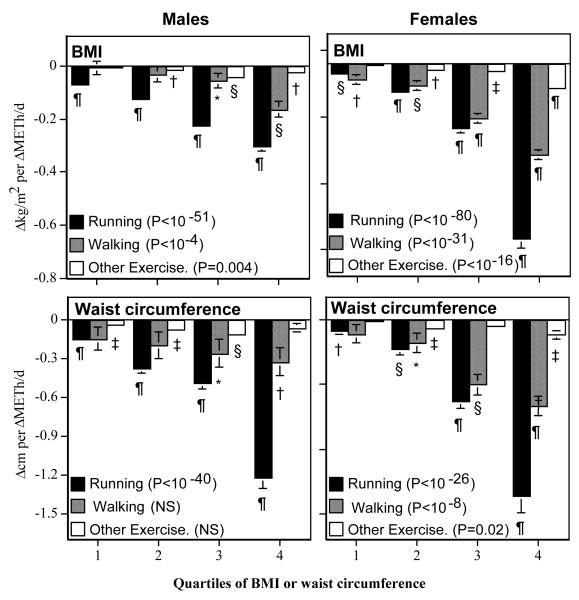
Figure 1.
Regression slopes for ΔBMI or ΔWaist circumference (dependent variables) vs. changes in exercise energy expenditure (ΔMETh/d, independent variable), stratified by quartiles of adiposity (Average of baseline and follow-up BMIs or waist circumferences). The significance levels associated with the key refer to the test for progressively increasing regression slopes with increasing adiposity. Significance of the individual regression slopes are coded: * P<0.05; † P<0.01; ‡ P<0.001; § P<0.0001; and ¶ P<10−15. The cut points for the 25th, 50th, and 75th quantiles were: 23.94, 26.08, and 28.62 kg/m2, respectively, for male BMI; 22.17, 26.08, and 27.90 kg/m2, respectively, for female BMI; 87.63, 92.71, and 99.06 cm, respectively, for male waist circumference; and 71.12, 77.47, and 85.72 cm, respectively, for female waist circumference.

