Abstract
To date, no effective therapeutic treatments have been developed for hypopharyngeal squamous cell carcinoma (HPSCC), a disease that has a five-year survival rate of approximately 31% because of its late diagnosis and aggressive nature. Despite recent improvements in diagnostic methods, there are no effective measures to prevent or detect HPSCC in an early stage. The goal of the current study was to identify molecular biomarkers and networks that can facilitate the speedy identification of HPSCC patients who could benefit from individualized treatment. Isobaric tags for relative and absolute quantification (iTRAQ) labeling was employed with two-dimensional liquid chromatography-tandem mass spectrometry to identify quantitatively the differentially expressed proteins among three types of HPSCC disease stages. The iTRAQ results were evaluated by literature searches and western blot analysis. For example, FUBP1, one of 412 proteins with significantly altered expression profiles, was confirmed to have elevated expression in fresh HPSCC tissues. Integrin-mediated cell matrix adhesion and actin filament-inducing cytoskeleton remodeling were the cellular events that were the most relevant to HPSCC tumorigenesis and the metastatic process. The construction of transcriptional regulation networks led to the identification of key transcriptional regulators of tumor development and lymph node metastasis of HPSCC, including Sp1, c-Myc and p53. Additionally, our study indicated that the interactions among Sp1, c-Myc and p53 may play vital roles in the carcinogenesis and metastasis of HPSCC.
Keywords: Proteomics analysis, Metastasis, Hypopharyngeal squamous cell carcinoma, Transcription factor network, iTRAQ, Carcinogenesis.
Introduction
Hypopharyngeal squamous cell carcinoma (HPSCC) is a serious health problem that caused approximately 2,330 deaths in the United States in 20121. In the recent decades, advances in diagnosis and treatment, but these efforts have resulted in marginal increases in survival times for patients 2. The clinical management of HPSCC, which has a more latent location and possibility of metastasis than other tumors in the head and neck region, has several challenges, such as early detection and tailored therapy 3. One of the most challenging problems facing radiologists is that the rapid differentiation of primary tumors and metastasis to lymph nodes requires evaluation of morphology by advanced methods such as computed tomography 4.
HPSCC, which has a five-year survival rate of approximately 31%, cannot be treated with satisfaction because of its late diagnosis and aggressive nature 5. Early diagnosis is hampered by asymptomatic traits and limited diagnostic approaches; therefore, it is necessary to identify molecular biomarkers that will enable the rapid identification of HPSCC patients who could benefit from personalized treatment 6. Molecular biomarkers, such as p53, Rb, p16, PTEN and hTERT, have been reported as prognostic indicators for several types of cancers, including HPSCC. However, none of these markers can singly contribute to the clinical decision-making process because each belongs to signaling pathways of multiple known or unknown proteins 7. Traditional methods of investigating proteins, such as western blotting, limit the number of proteins that can be investigated simultaneously. In contrast, proteomics studies can yield information on hundreds or thousands of proteins. Recent developments in cancer proteomics, as well as powerful bioinformatics tools that integrate information about various tumor suppressors, oncogenes, and complex molecular pathways, have contributed to the comprehensive analysis of HPSCC initiation, tumorigenesis, and metastasis 8.
Isobaric tagging for relative and absolute protein quantification (iTRAQ) is a proteomics technique developed to quantitatively investigate protein abundance changes in different biological samples with high accuracy and reproducibility 9. In this study, we employed iTRAQ combined with off-line two-dimensional (2D) LC-MS/MS to acquire mass-spectrometry results, which were converted into protein-identification results and collected to analyze the relative abundance changes of HPSCC-related proteins in tumor tissues by Protein Pilot software. After validation of the iTRAQ results by literature mining and western blotting, Cytoscape and MetaCore programs were employed for bioinformatic analysis of functionally related proteins and to obtain a more comprehensive insight into the molecular mechanisms that potentially underlying metastasis and tumorigenesis in HPSCC. Additionally, we investigated transcription factor crosstalk and regulatory networks that are related with the processes involved in HPSCC formation and development.
Materials and Methods
Sample Processing
Ten paired fresh tissue samples, including primary cancerous tissues matched with adjacent non-cancerous tissues and metastatic lymph nodes, were collected randomly from patients who were diagnosed with HPSCC from February 2010 to November 2010 at the Department of Otolaryngology of Xiangya Hospital in Central South University (detailed clinical information see the table 1). Pathology review confirmed the histological diagnosis of all patients. Three paired fresh samples for western blotting were collected in the same manner. Samples were cut into small pieces and frozen in liquid nitrogen or stored at -80°C until they were prepared for extraction. The Medical Research Ethics Committee of Xiangya Hospital (Changsha, China) approved the study.
Table 1.
Clinicopathological data
| Parameter | Patients |
|---|---|
| Clinical stage | |
| III | 7 |
| IV | 3 |
| T stage | |
| T1-T2 | 4 |
| T3-T4 | 6 |
| N stage | |
| N0 | 0 |
| N+ | 10 |
| M stage | |
| M0 | 10 |
| M+ | 0 |
| Pathological grade | |
| Low | 0 |
| Middle | 4 |
| High | 6 |
| Sex | |
| Male | 10 |
| Female | 0 |
| Age | |
| <=55 | 5 |
| >55 | 5 |
| Smoking | |
| Yes | 10 |
| No | 0 |
Protein Extraction and Digestion
Clinical tissue samples were categorized into three groups: normal adjacent tissue (NAT, 5 mm from the margin of the tumor), tumor tissue (CA, primary tumor) and metastatic lymph node (LN). Briefly, each sample was pestled in liquid nitrogen and mixed with 250 μL lysis solution containing 0.5 M triethylammonium bicarbonate and 0.1% (w/v) SDS. The mixture was homogenized with probe sonication (30×0.1 s, power set to 150 W) prior to solubilization for 1 h at room temperature. Cell debris was removed by centrifugation at 12,000 rpm at 4 °C for 15 min. Finally, the total protein remaining in the supernatant material was quantified using the Bradford assay.
Purification and digestion of the protein extracts were conducted as previously described 10, 11. Briefly, 100 mg of each extract was mixed with four volumes of cold (-20 °C) acetone containing 12% (w/v) trichloroacetic acid (TCA, Sinopharm Chemical Reagent Co., Ltd. Shanghai, China) and digested at 37°C overnight using sequencing-grade modified trypsin (Sigma, St. Louis, MO, USA) at a protein-to-enzyme ratio of 20:1.
Labeling with iTRAQ Reagents
Using the iTRAQ kit (Applied Biosystems, Foster City, CA) protocol, the peptides were labeled with iTRAQ tags as follows: NAT, iTRAQ 118 (IT118); CA, iTRAQ 121 (IT121); LN, iTRAQ 119(IT119). The labeled samples were mixed and dried by a rotary vacuum concentrator (Christ RVC 2-25; Osterode am Harz, Germany).
Peptide Fractionation and Off-Line 2D LC-MS/MS Analysis
The pooled mixture of proteins extracted from patient tissue samples was fractionated using strong cation exchange (SCX) chromatography on a 20AD high-performance liquid chromatography (HPLC) system (Shimadzu, Kyoto, Japan). The sample was re-constituted with loading buffers A (10 mM KH2PO4 in 25% acetonitrile, pH 2.6) and B (10 mM KH2PO4 and 350 mM KCl in 25% acetonitrile, pH 2.6) and loaded onto a 2.1 x100 mm, 5 µm, 200 Å column (The Nest Group, Inc. MA) for separation using a linear binary gradient of 0℃ 80% buffer B in buffer at a flow rate of 200 mL/min for one hour.
The absorption wavelengths of the UV detector were set to 214 and 280 nm and a total of 25 SCX fractions were collected along the gradient. The collected SCX fractions were dried using a rotary vacuum concentrator, dissolved in buffer C (5% ACN, 0.1% FA) and analyzed on a QSTAR XL system (Applied Biosystems) interfaced with a 20AD HPLC system (Shimadzu). Peptides were second dimension separated on a Zorbax column (0.1 3 15 mm, 5 mm, 300 Å;Microm, Auburn, CA). The HPLC gradient was 5℃35% buffer D (95% ACN, 0.1% FA) in buffer C at a flow rate of 0.3 ml/min for 70 min. dissolved and analyzed on a QSTAR XL system (Applied Biosystems, Carlsbad, CA, USA). In an information-dependent acquisition mode, an MS survey scan was acquired from m/z 400-1800 with up to the 4 most intense multiply charged ions selected for MS/MS analysis in the mass range m/z 100-2000. Each SCX fraction was analyzed in duplicate.
Protein Identification
Protein identification and quantification using the MS/MS spectra was performed using Protein Pilot v3.0 software (Applied Biosystems) according to the human International Protein Index (IPI) database v3.45. To minimize the false positive rate, a strict cutoff for protein identification was based on the following criteria: unused ProtScore > 1.3 and more than one peptide with 95% confidence per repetition. Protein relative expression ratios were based on the peak area ratios of the peptides from the same protein. The resulting dataset was auto bias-corrected to eliminate any variability due to unequal mixing of the various labeled digests. Fold changes in protein expression greater than 1.2 or less than 0.8 were determined to indicate significant proteins.
Western Blotting
Western blotting was applied as described previously 12. In brief, thirty microgram protein was loaded in 10% gels for sodium dodecyl sulfate-polyacrylamide gel electrophoresis (SDS-PAGE) and transferred onto PVDF membranes (Millipore, Bedford, MA). A mouse poly-antibody against FUBP1 (SC-101040, dilution 1:1000) (Santa Cruz, CA, USA) and a secondary antibody (Beyotime, China) were selected for incubation with the blotted membranes. An anti-β-actin antibody (Beyotime, China) was used as an internal reference. The experiments were repeated three times.
Data Mining and Analysis
MetaCore (Gene-Go; St. Joseph, MI, USA), an integrated program with manual databases and practical algorithms for functional analysis, was applied to the resulting dataset 13. The enriched biological pathway was searched against Gene Ontology datasets. To annotate the functions of the significantly expressed proteins that were identified in the study, the proteins were inputted into Gene-Go's MetaCore for analysis. The significantly expressed proteins were converted into their corresponding encoding genes, which were used as the input list for the generation of regulatory networks using a Transcription Regulation algorithm. Next, thirty sub-networks that were centered on transcription factors were generated and ranked by a p-value and interpreted in terms of Gene Ontology. A TRANSCRIPTION FACTOR crosstalk map was derived from the FANTOM database (http://fantom.gsc.riken.jp) and visualized by Cytoscape software 2.6.2 14.
To measure the reliability of the analysis results, comparisons with HPSCC genes published on Pubmed (http://www.ncbi.nlm.nih.gov/) and in EBI datasets (http://www.ebi.ac.uk/) were computed (up to June, 2013), and the Venny graphic tool (http://bioinfogp.cnb.csic.es/tools/venny/index.html) was used to describe the consistency within the above data. In addition, we converted our results into Microsoft Access data and randomly selected one of the datasets using a computer-generated algorithm. Next, western blotting was used to validate the selected proteins. After log transformation based on 1.2, all the protein expression data were loaded in centroid-linkage hierarchical clustering assay using Cluster3.0 (http://bonsai.hgc.jp/~mdehoon/software/cluster/software.htm#ctv)15. Then Java Treeview software (http://jtreeview.sourceforge.net/) were performed to present the hierarchical protein groups in the three types of samples.
Cell culture and proliferation
Tu686, M2 and M4 cell lines were primary tumor and different metastatic potential cell lines generated from lymph node as described previously16, which were gifts from warm heartedness Dr. Zhuo (Georgia) Chen (Emory University Winship Cancer Institute, Atlanta, Georgia). Tumor Cell lines were maintained as monolayer cultures in Dulbecco's modified Eagle's medium (DMEM)/F12 medium (1:1) supplemented with 10% fetal bovine serum (FBS) in a 37°C, 5% CO2 humidified incubator. Medium was changed every other day. Exponentially growing cells were used for the following experiments.
Cell growth test is detected by cell count kit 8 (Dojindo Molecular Technologies, Japan) at 450nm absorption like previously. In briefly, 1000 cells were seeding into 96-wells plate. The experiment was performed in continuous six days and repeated triple times.
Results
MS Results and Protein Abundance Changes in HPSCC
Seventy-eight percent of the total proteins that were identified in the combined data sets overlapped between the two MS replicates, and 643 proteins were quantified using a calibration based on a 1% global false discovery rate. The abundance of 412 proteins was altered in CA vs. NAT, with 204 proteins being overexpressed (more than 1.2-fold), and 208 proteins being under-expressed (less than 0.8-fold), which we also considered to be significant proteins (Additional file 1: Table S1). Furthermore, we also determined that 382 proteins showed differential expression in LN vs. NAT, 177 of which were overexpressed, and 205 were under-expressed (Additional file 2: Table S2).
Evaluation of iTRAQ Results by Public Data Mining and Western Blotting
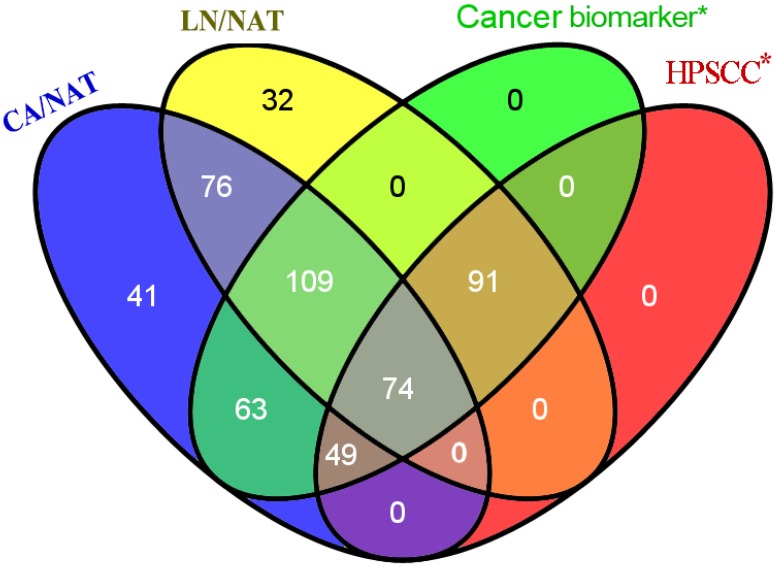
To identify the reliability of the experimental results, significant protein names were mapped to previously published literature and microarray expression datasets for primary human HPSCC samples. We subsequently used the Venny graphic tool to evaluate the number of biomarkers within our results and published data (Figure 1). As shown in Figure 1, 386 candidates in our iTRAQ results were reported in the analyses of different types of cancer, 214 of which were reported in studies of HPSCC. The identification of proteins that are involved in cell proliferation, invasion and migration from the iTRAQ dataset suggests a role in HPSCC carcinogenesis and metastasis. For example, CDH1 (E-cadherin) expression decreased between normal mucosa, tumor, and metastatic lymph node (CA/NAT = 0.8166, LN/CA = 0.5546 and LN/NAT = 0.4571, respectively).
Figure 1.
Venny diagram showed the distribution of proteins that exhibit the amount of probable biomarkers within our results and cancer-related or HPSCC publications. 386 candidates in our iTRAQ results were reported to correlate to at least one of different types of cancer, 214 of which were reported referring to HPSCC.* means only proteins presented in our iTRAQ results were searched.
In addition, we also verified the analysis results using a traditional approach. To investigate whether FUBP1 was overexpressed in HPSCC compared to normal tissue, we evaluated the protein's expression in three fresh cancerous tissues and matched adjacent non-cancerous tissues by western blot analysis. As shown in Figure 2, the elevated expression of FUBP1 was significantly different in tumor tissues than normal tissues. Given that FUBP1 was observed to over- expressed in several tumors 17, we further detect whether over-expressed FUBP1 in tumor cells would promote cell growth. Comparing with Tu686 and Vector control cells, the cell growth in elevated FUBP1 significantly increased (p<0.05, Additional file 4: Figure S1).
Figure 2.
Western blotting showed the over-expression of FUBP1 protein in cancer tissue and cell rather than normal mucosa. (A) 3 pairs of normal mucosa and tumor tissues respectively named NAT1/CA1, NAT2/CA2 and NAT3/CA3. β-actin was performed to be internal reference. (B) The expression of FUBP1in DOK, Tu686, M2 and M4 cell lines indicated FUBP1 up-regulated in malignant cell.
Cluster Analysis of Potential Biomarkers in HPSCC
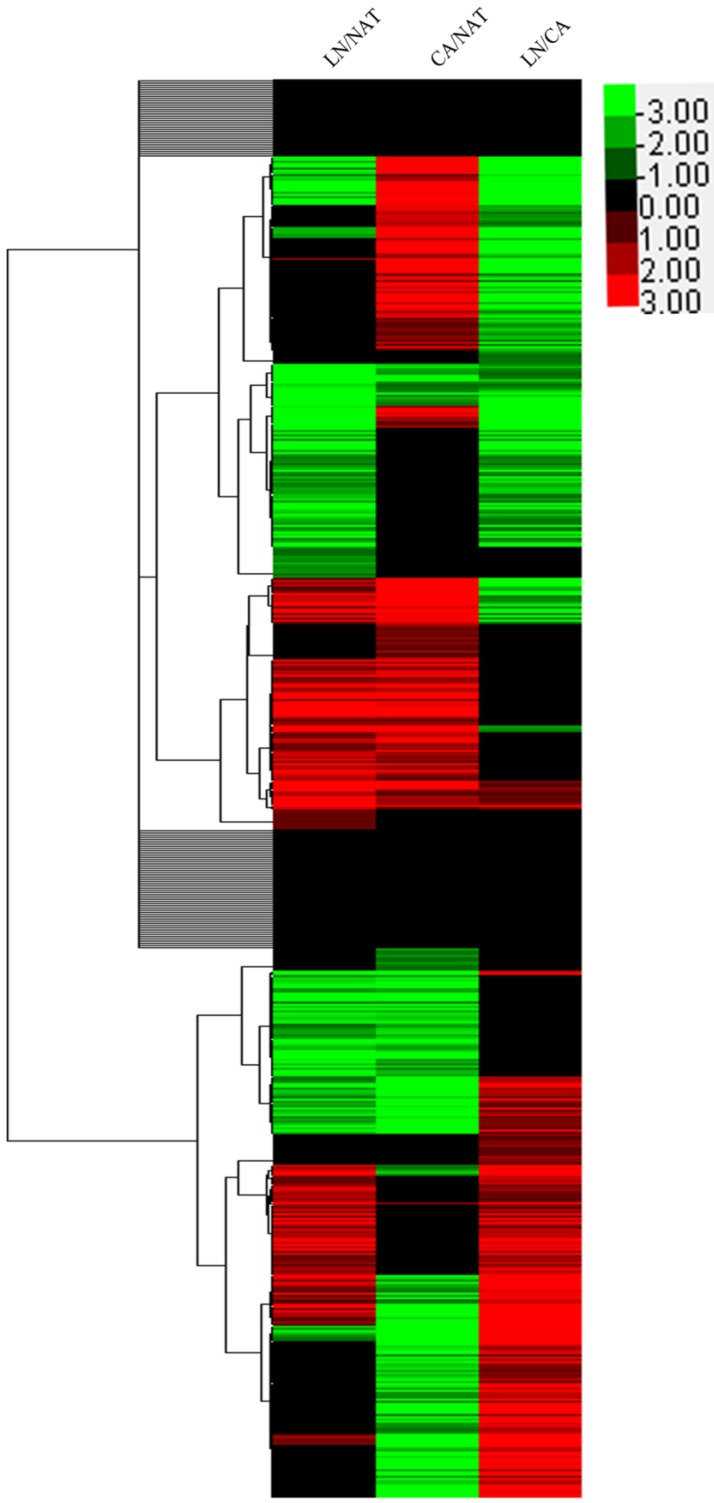
As shown in Figure 3, hierarchical clustering revealed that the differential expression trend of the significant proteins in NAT, CA and LN could support the different process of tumorigenesis and nodal metastasis. The global proteins clustering in these processes may provide evidence indirectly supporting the hypothesis that the metastatic process was similar to both developments of secondary tumor from the primary site and tumor from normal mucosa.
Figure 3.
Hierarchical clustering revealed that the global protein expressed tendency of from normal mucosa to tumor and metastatic lymph node. The color of green mean the relative abundance changed <0.8 whereas red color represented >1.2 and black color hold the value <1.2 and >0.8. The color from light to dark told the changed level from low to high.
Gene Ontology Analysis of the Significant Proteins
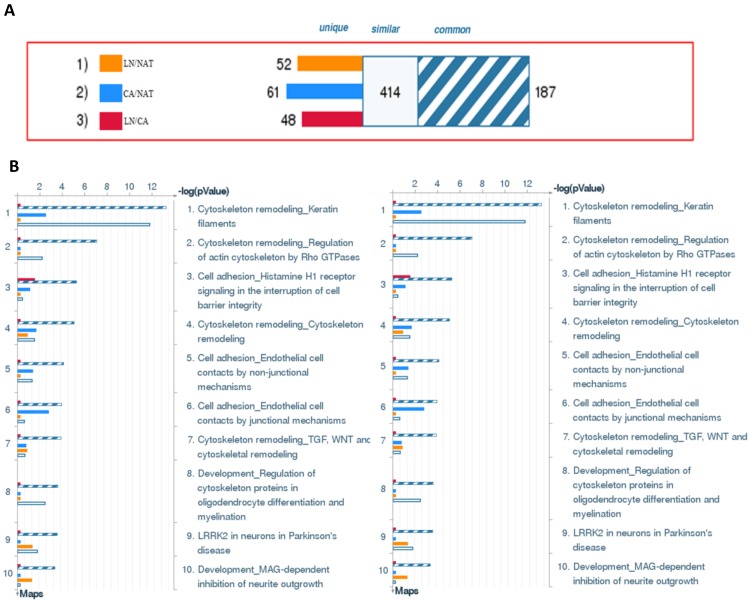
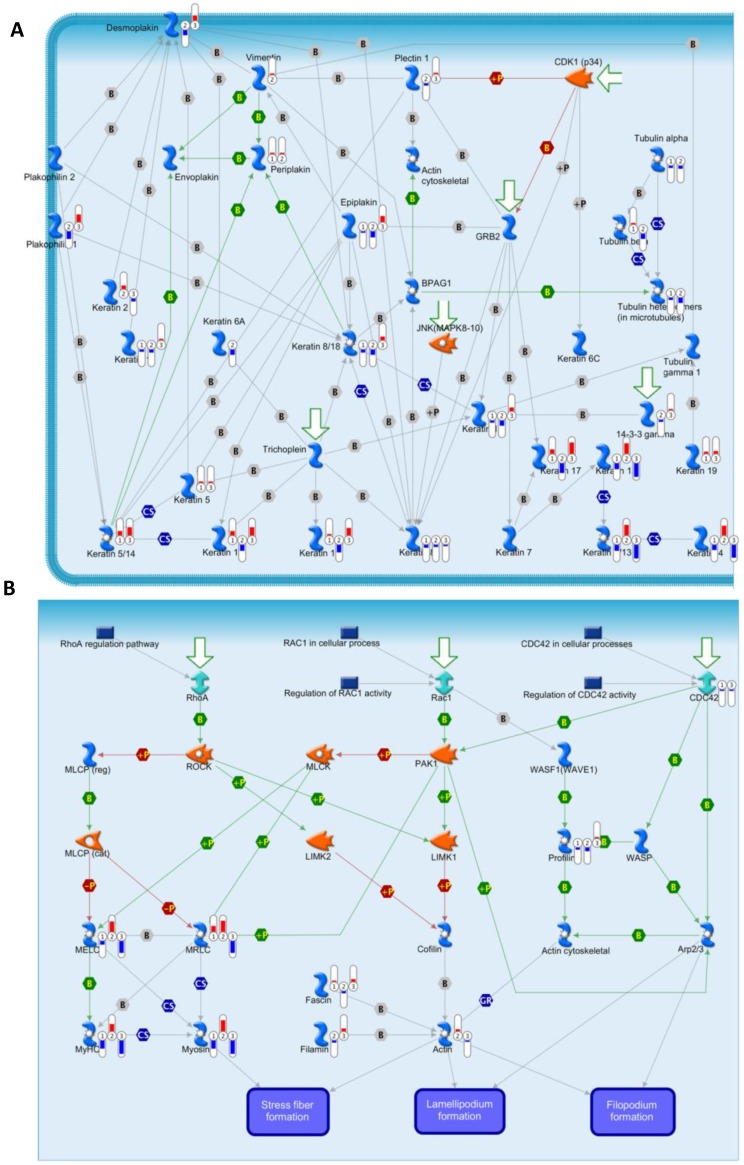
To annotate the dysregulated proteins in HPSCC further, we applied the MetaCore mapping tool to generate the enrichment analysis of pathway maps and cellular processes. Pathway analysis is used to provide comprehensive and novel insight into the potential biology that is influenced by differentially expressed proteins. Based the ability of pathway analysis to reduce complexity and increase explanatory power of the data18, clusters of under- and overexpressed proteins were mapped into different pathways and cellular processes (Figure 4B and 4C, respectively). The Gene Ontology analysis indicated that the majority of enriched significant pathway maps were involved in keratin filament-mediated cytoskeleton remodeling and Cytoskeleton remodeling-Regulation of actin cytoskeleton by Rho GTPases (Figure 5A and 5B, respectively).
Figure 4.
Top biological processes and maps of significant proteins in HPSCC. (A) The gene content is aligned between all uploaded experiments. The intersection set of the experiments is defined as “common” and marked as a blue/white striped bar. The unique genes for the experiments are marked as colored bars. The genes from the “similar” set are present in all but one (any) file. CA compared with NAT is marked as orange bars; LN compared with NAT is marked as blue bars. (B) Canonical pathway maps represent a set of about 650 signaling and metabolic maps covering human biology (signaling and metabolism) in a comprehensive way. All maps are drawn with GeneGo annotators and manually curated and edited. (C) These are about 110 cellular and molecular processes whose content is defined and annotated by GeneGo. Each process represents a preset network of protein interactions characteristic for the process. Experimental data is mapped on the processes.
Figure 5.
Experimental data from significant proteins is visualized on the maps of keratin filaments mediating-cytoskeleton remodeling (A) and Cytoskeleton remodeling_Regulation of actin cytoskeleton by Rho GTPases (B) as thermometer like figures. Upward thermometers have red color and indicate up regulated signals and down ward (blue) ones indicate down regulated expression levels of the genes.
Transcription Factor Crosstalk and Regulatory Networks
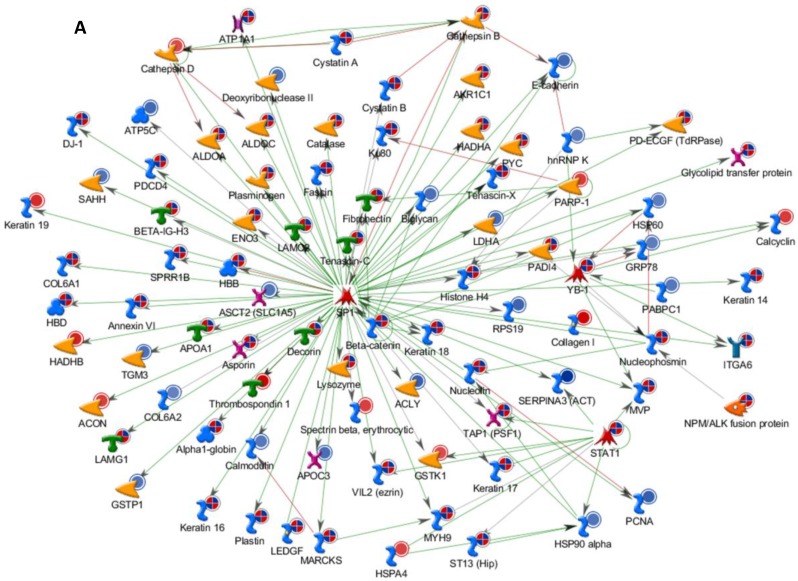
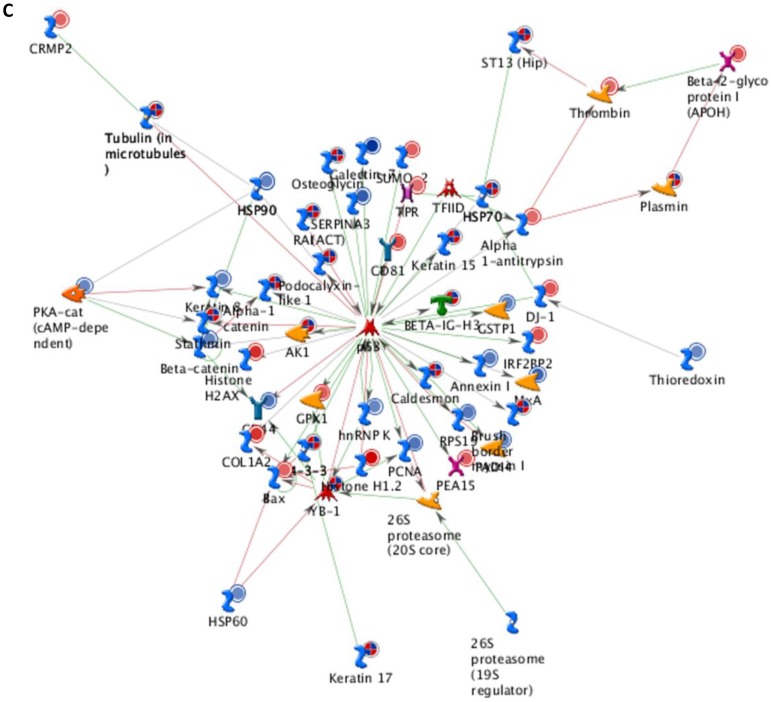
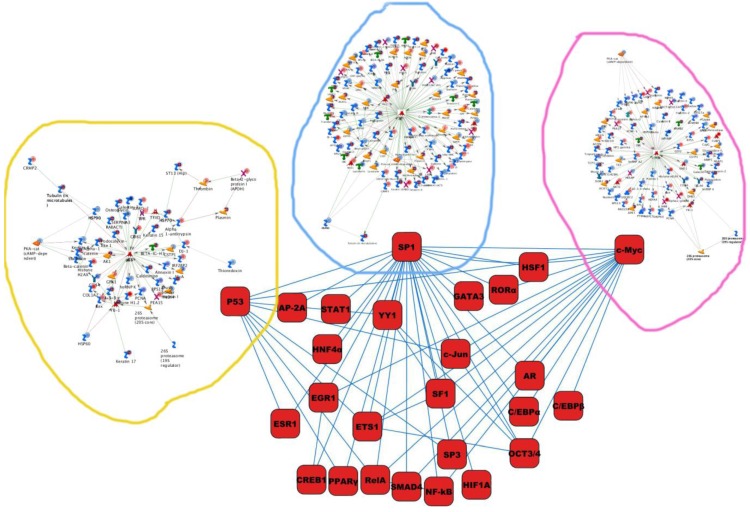
Differentially expressed proteins identified in the study were submitted to MetaCore and subjected to the Analyze Networks (AN) of the Transcription Regulation and Transcriptional Factor algorithm to further investigate the unknown pathways and associations between proteins. Thirty regulatory networks that were derived from the input lists in Additional file 1: Table S1 and Additional file 2: Table S2 of the supplemental materials were generated by this algorithm. The top ten scored regulatory networks were ranked on p-values ranging from 2.44e-232 to 6.80e-102 and were comprised of 48 - 105 proteins with altered expression (Additional file 3: Table S3), including the transcriptional regulation initiated by the activation of Sp1, c-myc, p53 and HNF4‑alpha. These proteins were connected through interactions with proteases (e.g., MMP-2, caspase-7), receptors (e.g., EGFR, alpha6/beta4, integrin), enzymes (e.g., p300, MDM2) and phosphatases (e.g., PPP2R2B) that were based on a MetaCore curated database. Therefore, any objects containing the most connections to the root objects (the transcription factors) could represent key regulators in the clustered proteins. As shown in Figure 6A, Sp1 could interact with many proteins in the associated network and directly or indirectly regulate their expression, including Profilin2, PCNA and HOXA7. P53 and c-Myc were also key network objects, and they are presented in Figure 6B and 6C (see Additional File 3: Table S3 for additional information). When all the networks were mapped to GO analysis, integrin-mediated cell matrix adhesion and actin filament-inducing cytoskeleton remodeling were the most relevant among the network processes (Figure 4C). A ranked set of pathways and processes, which contains proteins with differential abundance, could be beneficial to identify key drivers of HPSCC mechanisms of pathogenesis and metastasis. Furthermore, the crosstalk between these key network objects that involved all of the significantly altered proteins was based on the FANTOM database for a global perspective of these regulated networks (Figure 7). Interestingly, in accordance with MetaCore analysis, Sp1/c-myc and p53 were the most frequency targeted proteins in each of the interactions. Together with detailed transcription factor regulation maps, the transcription factor crosstalk map could describe the comprehensive molecular network involvement in the tumorigenesis and metastatic process of HPSCC.
Figure 6.
Transcriptional Factors Crosstalk and Regulation Networks in HPSCC. (A, B, C) Sp1, c-Myc, P53 (Homo sapiens), the top three) transcription regulation network were generated from active experiments. Thick cyan lines indicate the fragments of canonical pathways. Up-regulated genes are marked with red circles, and down-regulated ones with blue circles. The “checkerboard” color indicates mixed expression for the gene between files or between multiple tags for the same gene.
Figure 7.
The map of cross-talking within these transcriptional factors enriched in the current study.
Discussion
HPSCC is the poorest subtype of squamous carcinoma in the head and neck, which underlies a dispute concerning whether different disease mechanisms exist in subsites of head and neck cancers 19, 20. Compared to our previous work on laryngocarcinoma 11, the current investigation indicated that many comparisons can be drawn between hypopharyngeal and laryngeal carcinoma (data not shown). In this study, we comprehensively analyzed the proteins with significantly different expression levels and with functions that were related to HPSCC initiation and metastasis. The iTRAQ results were verified by literature mining and western blotting.
iTRAQ combined with 2D-LC/MS has been become a useful and reliable technique in the exploration of new and unknown mechanisms of complicated diseases 21. In our study, this advanced method generated regarding differentially expressed proteins that was used to generate hypothesis for further investigation. To validate the reliability of the technology, the iTRAQ results were confirmed by literature review in Pubmed and western blotting. We determined that 71.6% of these proteins were correlated with other cancers, which indicated that our data were consistent with those of other scientists. Based on published literature 17, 22, 23 and our iTRAQ results, FUBP1 was confirmed to be significantly overexpressed in tumor tissue compared to normal mucosa which keeps according with the literatures in liver and gastric carcinoma. In addition, we found that elevated FUBP1 expression in Tu686 cells enhanced its proliferation. To our limited knowledge, it is first time to report FUBP1 as an oncogene in cell experiment. Taken together, our iTRAQ results provide adequate accuracy and precision in identifying differentially expressed genes that may serve as potential targets for HPSCC.
In the current study, hierarchical clustering was performed to investigate changes in protein expression among the three groups of samples. Tight clustering between CA/NAT and LN/NAT revealed a similar change of these molecules in the process of HPSCC initiation and lymph node metastasis. Migration and invasion require the downregulation of cell adhesion molecules and cell cytoskeleton remodeling to facilitate cell motility. This model is in accordance with the Gene Ontology analysis results of the differentially expressed protein list from the dataset.
Transcription factors are viewed as key regulators of cell fate and behavior 24. Constructing networks that describe transcription factor crosstalk and regulation is necessary to elucidate the mechanisms that underlie the process of carcinogenesis and metastasis. To the best of our knowledge, only a small number of studies have reported that transcription factor crosstalk is involved in HPSCC at the protein level. This study provides a new overall perception of the underlying molecular basis of HPSCC initiation and metastasis. We employed Panther/FANTOM Database and Analyze Networks (AN) and determined that the most important regulators of transcription factor crosstalk were associated with key biological processes, such as keratin filaments-mediated cytoskeleton remodeling and Cytoskeleton remodeling-Regulation of actin cytoskeleton by Rho GTPases.
Specificity protein 1 (Sp1), a C2H2-type zinc finger protein, has been widely reported as a ubiquitously expressed transcription factor that regulates various genes containing GC boxes within their promoters 25, 26. In addition, accumulating evidence has demonstrated that frequent overexpression of Sp1 exists in various types of human tumors including squamous cervical carcinoma, indicating that high Sp1 expression correlates with the aggressive biological processes of these tumors 27-29. To date, there has been limited research examining the role of Sp1 in HPSCC. In our current study, the core of the Sp1 transcription regulation network was ranked as the most significant in the comparison of LN with NAT, which was consistent with cell-based experiments in head and neck squamous cancer 30. Our previous studies indicated that epithelial mesenchymal transition (EMT) and anoikis-resistance are two characteristics of metastatic HNSCC cells 31. Sp1 network molecules, such as PCNA, β-catenin, keratins, collagens, fibronectin and vitronectin, are related to cytoskeleton remodeling and cell adhesion, and therefore participate in the regulation of the pathologic processes of EMT and anoikis-resistance during lymph node metastasis. The detailed mechanism whereby Sp1 promotes malignant behavior in HPSCC requires further analysis.
Wild-type p53 is considered a tumor suppressor gene, but mutant p53 can have an entirely opposite function, such as promoting tumor progression and metastasis 32. Mutations in the p53 gene can be detected in at least 50% of human cancer cells, including HPSCC 33. Analysis of the entire coding sequence in 21 primary HNSCC lines confirmed earlier studies that identified an increased incidence of p53 mutation is associated with the progression of HNSCC from a noninvasive to an invasive phenotype 34.
The current understanding of the function of p53 was mostly derived from identification of genes with expression levels that are elevated by p53 activity, including p21 35, BAX 36 and HnRNP-K 37. A similar pattern is reflected in our current study. Ohlsson et al. reported that the interaction between p53 and Sp1 induced tyrosine phosphorylation in an osteosarcoma cell line via the regulation of insulin-like growth factor-1 receptor expression 38. Taken together with the crosstalk and regulation map of transcription factors, we determined that the interaction of Sp1 with p53 may directly or indirectly affect the expression of extracellular matrix (ECM) components, for example, desmin, vimentin, keratin14 and tropomyosin-1, that are related with cytoskeleton remodeling and cell adhesion and are critical EMT39.
C-myc, which is deregulated in most human tumor types and stages, regulates cell cycle and cell growth, promotes genomic instability, and stimulates angiogenesis, cell transformation and apoptosis. Interestingly, cell cycle arresting genes, such as p15, p21 and p27, and cell cycle promoting genes, including cdc25A, cdk4 and cyclin D2 40, which are the transcriptional targets of c-Myc, may account for cell transformation to a greater extent than c-Myc itself 41. Furthermore, the central region of c-Myc can bind Sp1 transcription factor and inhibit Sp1 transcriptional activity. This may be at least one of the mechanisms whereby c-Myc suppresses the transcription of growth arrest genes 42. Frederick et al. reported that the levels of c-Myc mRNA and protein were rapidly and profoundly decreased after infection with wild-type p53 in HNSCC cell lines 43, which supported the possibility that the reduction of c-myc may be attenuated by the accumulation of mutant p53 in HNSCC patients. In addition, Joanna et al. determined that Sp1 could be a transcription cofactor that cooperates with p53 in the ablation of metabolic genes in diverse cancers, and p53 could inhibit c-Myc to mediate the ablation of several glycolytic genes in the human tumor cell line 44. In this study, the interactions among Sp1/p53/c-Myc could play vital roles in the process of HPSCC metastasis and carcinogenesis.
In brief, we quantified differentially expressed proteins that are involved in HPSCC, and we developed transcription factor crosstalk and regulatory networks that are associated with the process of initiation and metastasis via iTRAQ-2DLC-MS/MS and bioinformatic software analyses. Hundreds of proteins that are mapped onto such networks as the cytoskeleton remodeling and cell adhesion pathways were identified as molecules that have roles in tumorigenesis and metastasis.
Clinical Perspectives
The current study provides comprehensive insights into the molecular regulated and interacted networks that are involved in HPSCC carcinogenesis and metastasis, which may help to identify new strategies to improve HPSCC survival.
Supplementary Material
Table S1.
Table S2.
Table S3.
Figure S1.
Acknowledgments
Grants were provided by the National Natural Science Foundation of China (No. 81071757, No.81272974), the Research Fund for the Doctoral Program of Higher Education of China (No. 20120162120036), the Freedom Explore Program of Central South University (No.2012QNZT099) and Key Program of Science and Technology of Hunan Province, China (No.2010TP4012-1). We also appreciate MaKendra Umstead for English language suggestion.
Abbreviations
- HPSCC
Hypopharyngeal squamous cell carcinoma
- iTRAQ
Isobaric tags for relative and absolute quantification
- NAT
Normal adjacent tissue
- CA
Tumor tissue
- LN
Metastatic lymph node.
References
- 1.Siegel R, Naishadham D, Jemal A. Cancer statistics, 2012. CA Cancer J Clin. 2012;62(1):10–29. doi: 10.3322/caac.20138. [DOI] [PubMed] [Google Scholar]
- 2.Braakhuis BJ, Senft A. et al. Expression profiling and prediction of distant metastases in head and neck squamous cell carcinoma. J Clin Pathol. 2006;59(12):1254–1260. doi: 10.1136/jcp.2005.035451. [DOI] [PMC free article] [PubMed] [Google Scholar]
- 3.Schaaij-Visse TB, Brakenhoff RH Leemans CR. et al. Protein biomarker discovery for head and neck cancer. J Proteomics. 2010;73(10):1790–1803. doi: 10.1016/j.jprot.2010.01.013. [DOI] [PubMed] [Google Scholar]
- 4.Vandecaveye V, De Keyzer F, Vander P. V. et al. Head and neck squamous cell carcinoma: value of diffusion-weighted mr imaging for nodal staging. Radiology. 2009;251(1):134–146. doi: 10.1148/radiol.2511080128. [DOI] [PubMed] [Google Scholar]
- 5.Hayashi J, Sakata KI, Someya M. et al. Analysis and results of ku and xrcc4 expression in hypopharyngeal cancer tissues treated with chemoradiotherapy. Oncol Lett. 2012;4(1):151–155. doi: 10.3892/ol.2012.674. [DOI] [PMC free article] [PubMed] [Google Scholar]
- 6.Sepiashvili L, Hui A, Ignatchenko V. et al. Potentially novel candidate biomarkers for head and neck squamous cell carcinoma identified using an integrated cell line-based discovery strategy. Mol Cell Proteomics. 2012;11(11):1404–1415. doi: 10.1074/mcp.M112.020933. [DOI] [PMC free article] [PubMed] [Google Scholar]
- 7.Feng Z, Xu Q, Chen W. Epigenetic and genetic alterations-based molecular classification of head and neck cancer. Expert Rev Mol Diagn. 2012;12(3):279–290. doi: 10.1586/erm.12.19. [DOI] [PubMed] [Google Scholar]
- 8.Hanahan D, Weinberg RA. Hallmarks of cancer: the next generation. Cell. 2011;144(5):646–674. doi: 10.1016/j.cell.2011.02.013. [DOI] [PubMed] [Google Scholar]
- 9.Zhang XP, Yin XF, Yu HH. et al. Quantitative proteomic analysis of serum proteins in patients with parkinson's disease using an isobaric tag for relative and absolute quantification labeling, two-dimensional liquid chromatography, and tandem mass spectrometry. ANALYST. 2012;137(2):490–495. doi: 10.1039/c1an15551b. [DOI] [PubMed] [Google Scholar]
- 10.Wu D, Zhu D, Xu M. et al. Analysis of transcriptional factors and regulation networks in patients with acute renal allograft rejection. J Proteome Res. 2011;10(1):175–181. doi: 10.1021/pr100473w. [DOI] [PubMed] [Google Scholar]
- 11.Cai GM, Huang DH, Dai YZ. et al. Analysis of transcriptional factors and regulation networks in laryngeal squamous cell carcinoma patients with lymph node metastasis. J Proteome Res. 2012;11(2):1100–1107. doi: 10.1021/pr200831g. [DOI] [PubMed] [Google Scholar]
- 12.Liu Y, Yu C, Qiu Y. et al. Downregulation of epha2 expression suppresses the growth and metastasis in squamous-cell carcinoma of the head and neck in vitro and in vivo. J Cancer Res Clin Oncol. 2012;138(2):195–202. doi: 10.1007/s00432-011-1087-9. [DOI] [PubMed] [Google Scholar]
- 13.Nikolsky Y, Kirillov E, Zuev R. et al. Functional analysis of omics data and small molecule compounds in an integrated "knowledge-based" platform. Methods Mol Biol. 2009;563:177–196. doi: 10.1007/978-1-60761-175-2_10. [DOI] [PubMed] [Google Scholar]
- 14.Severin J, Waterhouse AM, Kawaji H. et al. Fantom4 edgeexpressdb: an integrated database of promoters, genes, micrornas, expression dynamics and regulatory interactions. Genome Biol. 2009;10(4):R39. doi: 10.1186/gb-2009-10-4-r39. [DOI] [PMC free article] [PubMed] [Google Scholar]
- 15.de Hoon MJ, Imoto S, Nolan J. et al. Open source clustering software. Bioinformatics. 2004;20(9):1453–1454. doi: 10.1093/bioinformatics/bth078. [DOI] [PubMed] [Google Scholar]
- 16.Zhang X, Hunt JL, Landsittel DP. et al. Correlation of protease-activated receptor-1 with differentiation markers in squamous cell carcinoma of the head and neck and its implication in lymph node metastasis. Clin Cancer Res. 2004;10(24):8451–8459. doi: 10.1158/1078-0432.CCR-04-0546. [DOI] [PubMed] [Google Scholar]
- 17.Zhang F, Tian Q, Wang Y. Far upstream element-binding protein 1 (fubp1) is overexpressed in human gastric cancer tissue compared to non-cancerous tissue. Onkologie. 2013;36(11b):650–655. doi: 10.1159/000355659. [DOI] [PubMed] [Google Scholar]
- 18.Khatri P, Sirota M, Butte AJ. Ten years of pathway analysis: current approaches and outstanding challenges. PLoS Comput Biol. 2012;8(2e):1002375. doi: 10.1371/journal.pcbi.1002375. [DOI] [PMC free article] [PubMed] [Google Scholar]
- 19.Huang Q, Yu GP, Mccormick SA. et al. Genetic differences detected by comparative genomic hybridization in head and neck squamous cell carcinomas from different tumor sites: construction of oncogenetic trees for tumor progression. Genes Chromosomes Cancer. 2002;34(2):224–233. doi: 10.1002/gcc.10062. [DOI] [PubMed] [Google Scholar]
- 20.Weinberger PM, Merkley M, Lee JR. et al. Use of combination proteomic analysis to demonstrate molecular similarity of head and neck squamous cell carcinoma arising from different subsites. Arch Otolaryngol Head Neck Surg. 2009;135(7):694–703. doi: 10.1001/archoto.2009.78. [DOI] [PMC free article] [PubMed] [Google Scholar]
- 21.Lu Q, Bai J, Zhang L. et al. Two-dimensional liquid chromatography-tandem mass spectrometry coupled with isobaric tags for relative and absolute quantification (itraq) labeling approach revealed first proteome profiles of pulmonary alveolar macrophages infected with porcine reproductive and respiratory syndrome virus. J Proteome Res. 2012;11(5):2890–2903. doi: 10.1021/pr201266z. [DOI] [PubMed] [Google Scholar]
- 22.Jiao Y, Killela PJ, Reitman ZJ. et al. Frequent atrx, cic, and fubp1 mutations refine the classification of malignant gliomas. Oncotarget. 2012;3(7):709–722. doi: 10.18632/oncotarget.588. [DOI] [PMC free article] [PubMed] [Google Scholar]
- 23.Bettegowda C, Agrawal N, Jiao Y. et al. Mutations in cic and fubp1 contribute to human oligodendroglioma. Science. 2011;333(6048):1453–1455. doi: 10.1126/science.1210557. [DOI] [PMC free article] [PubMed] [Google Scholar]
- 24.Wang J, Sun Y, Zheng S. et al. Apg: an active protein-gene network model to quantify regulatory signals in complex biological systems. Sci Rep. 2013;3:1097. doi: 10.1038/srep01097. [DOI] [PMC free article] [PubMed] [Google Scholar]
- 25.Chu S. Transcriptional regulation by post-transcriptional modification--role of phosphorylation in sp1 transcriptional activity. Gene. 2012;508(1):1–8. doi: 10.1016/j.gene.2012.07.022. [DOI] [PubMed] [Google Scholar]
- 26.Aslam F, Palumbo L, Augenlicht LH. et al. The sp family of transcription factors in the regulation of the human and mouse muc2 gene promoters. Cancer Res. 2001;61(2):570–576. [PubMed] [Google Scholar]
- 27.Wang F, Li Y, Zhou J. et al. Mir-375 is down-regulated in squamous cervical cancer and inhibits cell migration and invasion via targeting transcription factor sp1. Am J Pathol. 2011;179(5):2580–2588. doi: 10.1016/j.ajpath.2011.07.037. [DOI] [PMC free article] [PubMed] [Google Scholar]
- 28.Yue L, Li L, Liu F. et al. The oncoprotein hbxip activates transcriptional coregulatory protein lmo4 via sp1 to promote proliferation of breast cancer cells. Carcinogenesis. 2013;34(4):927–935. doi: 10.1093/carcin/bgs399. [DOI] [PMC free article] [PubMed] [Google Scholar]
- 29.Huang PH, Wang D, Chuang HC. et al. Alpha-tocopheryl succinate and derivatives mediate the transcriptional repression of androgen receptor in prostate cancer cells by targeting the pp2a-jnk-sp1-signaling axis. Carcinogenesis. 2009;30(7):1125–1131. doi: 10.1093/carcin/bgp112. [DOI] [PMC free article] [PubMed] [Google Scholar]
- 30.Jerhammar F, Ceder R, Garvin S. et al. Fibronectin 1 is a potential biomarker for radioresistance in head and neck squamous cell carcinoma. Cancer Biol Ther. 2010;10(12):1244–1251. doi: 10.4161/cbt.10.12.13432. [DOI] [PubMed] [Google Scholar]
- 31.Zhang X, Su L, Pirani AA. et al. Understanding metastatic scchn cells from unique genotypes to phenotypes with the aid of an animal model and dna microarray analysis. Clin Exp Metastasis. 2006;23(3-4):209–222. doi: 10.1007/s10585-006-9031-0. [DOI] [PubMed] [Google Scholar]
- 32.Brosh R, Rotter V. When mutants gain new powers: news from the mutant p53 field. Nat Rev Cancer. 2009;9(10):701–713. doi: 10.1038/nrc2693. [DOI] [PubMed] [Google Scholar]
- 33.Wang MJ, Pei DS, Qian GW. et al. P53 regulates ki-67 promoter activity through p53- and sp1-dependent manner in hela cells. Tumour Biol. 2011;32(5):905–912. doi: 10.1007/s13277-011-0191-4. [DOI] [PubMed] [Google Scholar]
- 34.Boyle JO, Hakim J, Koch W. et al. The incidence of p53 mutations increases with progression of head and neck cancer. Cancer Res. 1993;53(19):4477–4480. [PubMed] [Google Scholar]
- 35.El-Deiry WS. Regulation of p53 downstream genes. Semin Cancer Biol. 1998;8(5):345–357. doi: 10.1006/scbi.1998.0097. [DOI] [PubMed] [Google Scholar]
- 36.Liu X, Wilcken R, Joerger AC, Small molecule induced reactivation of mutant p53 in cancer cells. Nucleic Acids Res. 2013. [DOI] [PMC free article] [PubMed]
- 37.Lee SW, Lee MH, Park JH. et al. Sumoylation of hnrnp-k is required for p53-mediated cell-cycle arrest in response to dna damage. EMBO J. 2012;31(23):4441–4452. doi: 10.1038/emboj.2012.293. [DOI] [PMC free article] [PubMed] [Google Scholar]
- 38.Ohlsson C, Kley N, Werner H. et al. P53 regulates insulin-like growth factor-i (igf-i) receptor expression and igf-i-induced tyrosine phosphorylation in an osteosarcoma cell line: interaction between p53 and sp1. Endocrinology. 1998;139(3):1101–1107. doi: 10.1210/endo.139.3.5832. [DOI] [PubMed] [Google Scholar]
- 39.Levayer R, Lecuit T. Breaking down emt. Nat Cell Biol. 2008. 10(7), 757-759. [DOI] [PubMed]
- 40.Oster SK, Ho CS, Soucie EL. et al. The myc oncogene: marvelously complex. Adv Cancer Res. 2002;84:81–154. doi: 10.1016/s0065-230x(02)84004-0. [DOI] [PubMed] [Google Scholar]
- 41.Xiao Q, Claassen G, Shi J. et al. Transactivation-defective c-mycs retains the ability to regulate proliferation and apoptosis. Genes Dev. 1998;12(24):3803–3808. doi: 10.1101/gad.12.24.3803. [DOI] [PMC free article] [PubMed] [Google Scholar]
- 42.Gartel AL, Shchors K. Mechanisms of c-myc-mediated transcriptional repression of growth arrest genes. Exp Cell Res. 2003;283(1):17–21. doi: 10.1016/s0014-4827(02)00020-4. [DOI] [PubMed] [Google Scholar]
- 43.Frederick MJ, Holton PR, Hudson M. et al. Expression of apoptosis-related genes in human head and neck squamous cell carcinomas undergoing p53-mediated programmed cell death. Clin Cancer Res. 1999;5(2):361–369. [PubMed] [Google Scholar]
- 44.Zawacka-Pankau J, Grinkevich VV, Hunten S. et al. Inhibition of glycolytic enzymes mediated by pharmacologically activated p53: targeting warburg effect to fight cancer. J Biol Chem. 2011;286(48):41600–41615. doi: 10.1074/jbc.M111.240812. [DOI] [PMC free article] [PubMed] [Google Scholar]
Associated Data
This section collects any data citations, data availability statements, or supplementary materials included in this article.
Supplementary Materials
Table S1.
Table S2.
Table S3.
Figure S1.


