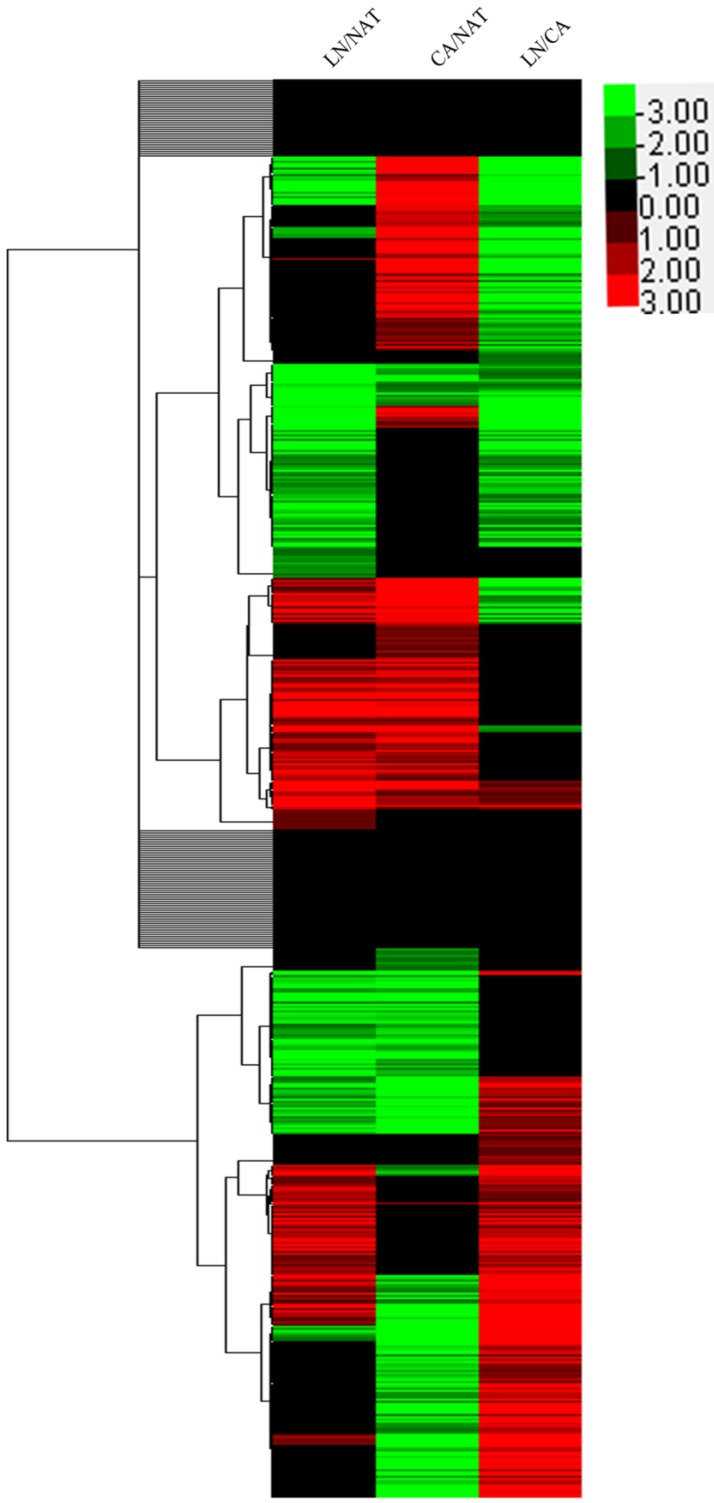
Figure 3.
Hierarchical clustering revealed that the global protein expressed tendency of from normal mucosa to tumor and metastatic lymph node. The color of green mean the relative abundance changed <0.8 whereas red color represented >1.2 and black color hold the value <1.2 and >0.8. The color from light to dark told the changed level from low to high.

