
FIGURE 4.
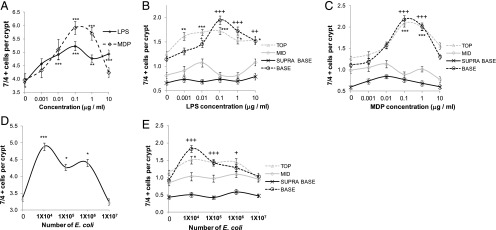
Concentration-dependent increase in 7/4+ cells in the colonic mucosa following 1 h of luminal stimulation with LPS, MDP, or E. coli. LPS caused a concentration-dependent increase in the total number of 7/4+ cells in the mucosa (A), whereas MDP (A) and E. coli (D) exhibited a dome-shaped concentration response curve (n = 3). LPS (B), MDP (C), and E. coli (E) caused a significant increase in the numbers of 7/4+ cells present in the top (n = 3) and base regions (n = 3) of the colonic mucosa compared with control-treated explants. Data are mean ± SEM. *p < 0.05, **p < 0.01, ***p < 0.001, +p < 0.05, ++p < 0.01, +++p < 0.001.