
Figure 6.
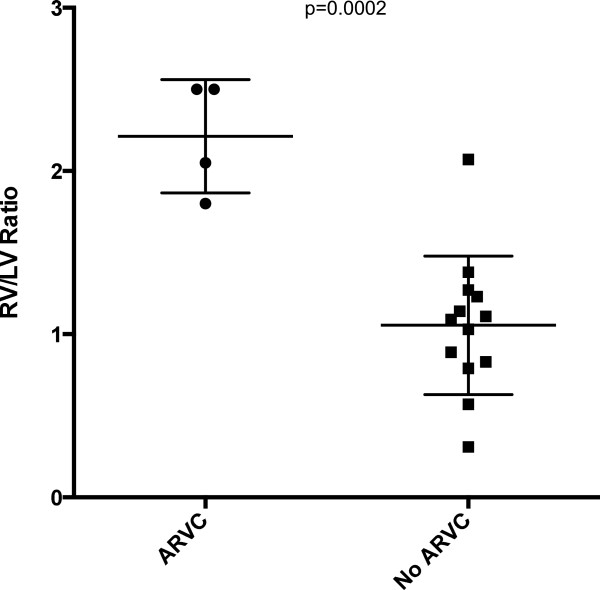
Scatter plot showing significantly larger RV: LV ratio in patients with ARVC (RV: LV= 2.2 ± 0.3) compared to those who did not have a diagnosis of ARVC (RV: LV= 1.1 ± 0.4, p=0.0002).
Official websites use .gov
A
.gov website belongs to an official
government organization in the United States.
Secure .gov websites use HTTPS
A lock (
) or https:// means you've safely
connected to the .gov website. Share sensitive
information only on official, secure websites.
Scatter plot showing significantly larger RV: LV ratio in patients with ARVC (RV: LV= 2.2 ± 0.3) compared to those who did not have a diagnosis of ARVC (RV: LV= 1.1 ± 0.4, p=0.0002).