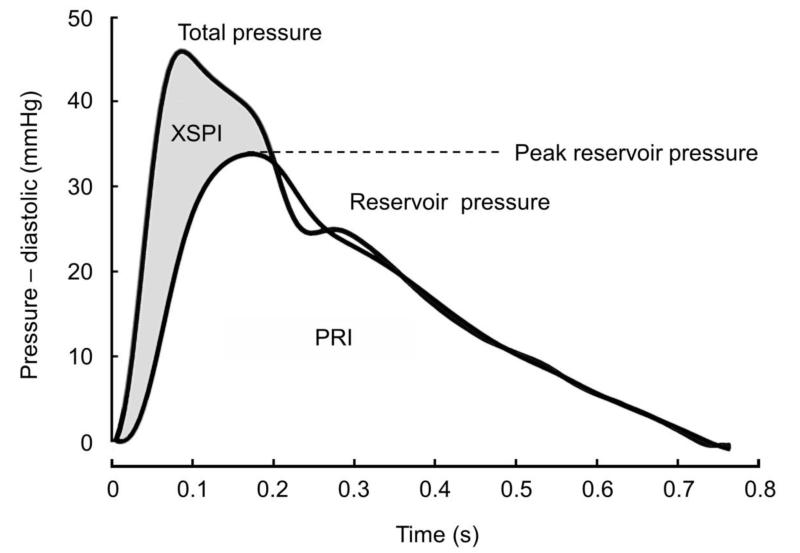
Figure 2. A representative example of separation of the pressure waveform into excess and reservoir pressure.
The trace shows a pressure waveform recorded using an arterial tonometer and calibrated to brachial systolic and diastolic pressure. The reservoir pressure waveform was then calculated the algorithm described in methods. Excess pressure (shaded grey) was calculated by subtracting the reservoir pressure from the measured pressure waveform. Peak reservoir pressure is indicated.

