
Figure 5.
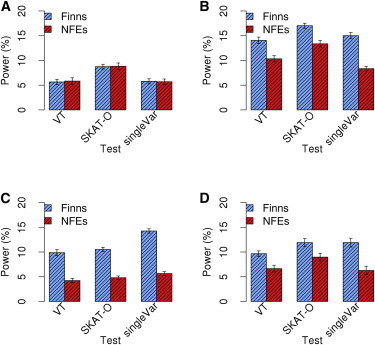
Power of Exome Sequencing Studies in 30,000 Finns versus 30,000 NFEs
We simulated a QT (h2 = 80%) for which aggregated coding variation in 1,000 genes explains the total heritability. We generated models M1–M4 by varying the degree of coupling (τ) between a causal variant’s phenotypic effect and the strength of purifying selection against that variant. We compared SKAT-O, the VT test, and single-variant tests (singleVar). For each model, means and SDs of power were calculated on the basis of 20 simulated data sets.
(A) M1 (τ = 0).
(B) M2 (τ = 0.5).
(C) M3 (τ = 1).
(D) M4 (τ randomly sampled from 0, 0.5, and 1 for each effect gene).