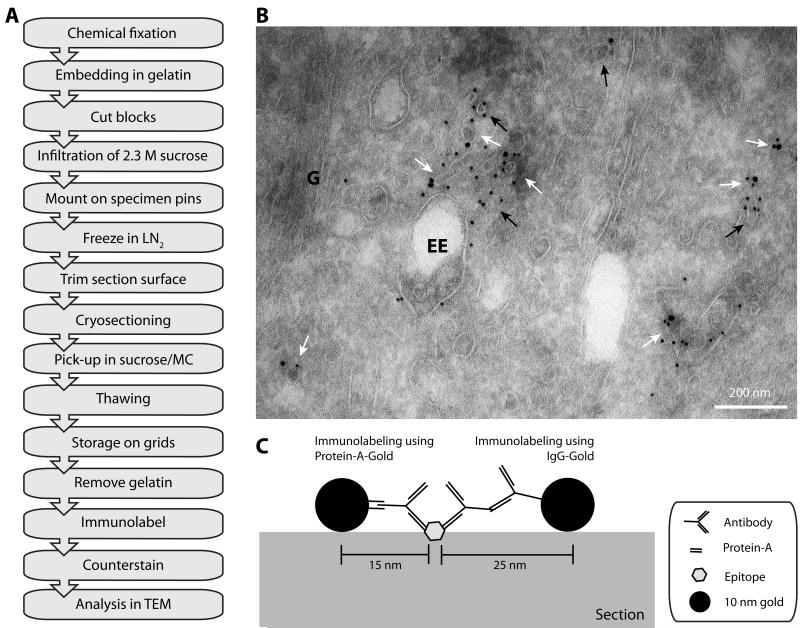
Figure 2. Immunolabeling the endosomal compartment using the Tokuyasu method.
A: Flow diagram of a typical immuno-EM experiment using the Tokuyasu method (see section III.1.b. for details). (LN2) liquid nitrogen, (MC) methylcellulose, (TEM) transmission electron microscope. B: Electron micrograph of immunogold labeling for GFP and RFP of HeLa cells, expressing GFP-SNX1 and RFP-Rab5, processed according to the Tokuyasu method. Ultrathin sections were labeled by GFP and RFP antibodies and PAG (10 and 15 nm, respectively). White arrows indicate tubular/vesicular profiles that are labeled by both sizes of gold, black arrows indicate membrane structures only labeled for one protein. (G) Golgi complex, (EE) early endosomal vacuole. Scale bar represents 200 nm. C: Cartoon of immunogold labeling of an epitope on the surface of the ultrathin section. Protein-A-Gold markers have a higher resolution (within 15 nm distance of the epitope) compared to IgG-Gold (within 25 nm distance of the epitope) due to the larger size of the secondary antibody. Adapted from (Verkade et al., 1997).

