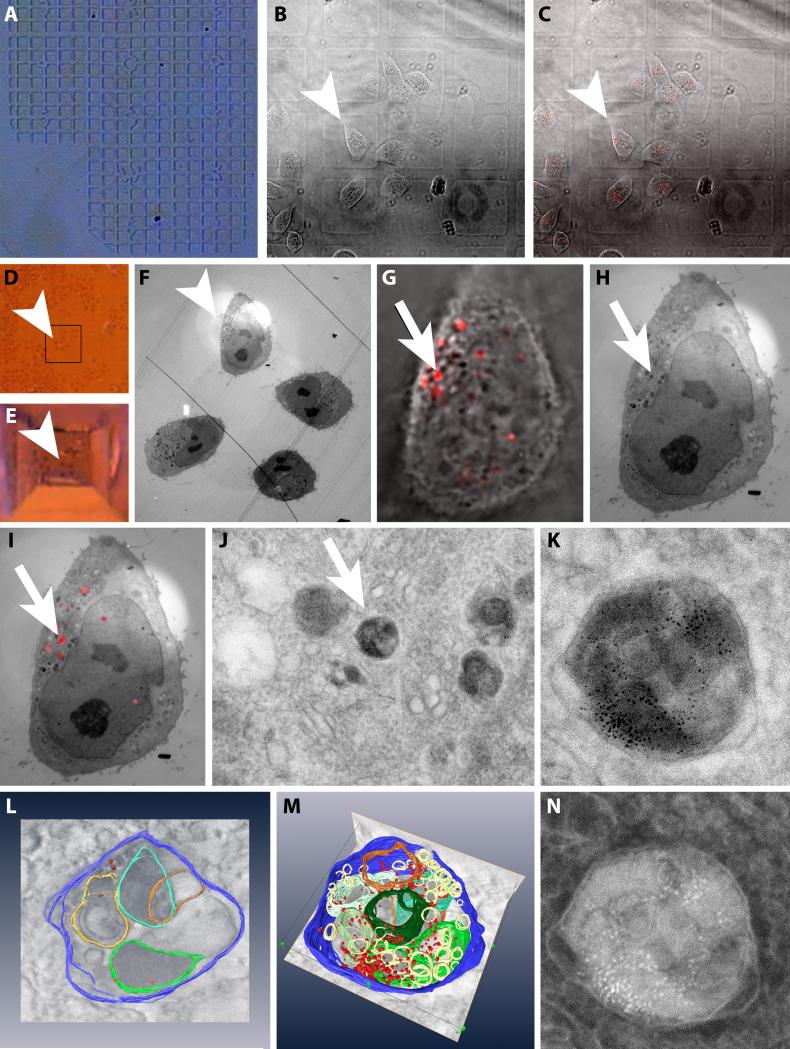
Figure 5. A simple CLEM experiment including 3-D reconstruction by electron tomography.
Example images of a CLEM experiment using the simple method described in section III.3.a A: The finder pattern of the embossed coverslip. B: DIC image of HeLa cells grown on the embossed coverslip. Arrowhead points to the cell of interest (images B-F). C: Overlay of B and a fluorescence image of the cells that have internalized EGF-biotin coupled to streptavidin-QD 655. D: Stereo microscopic image of the region of the cells of interest after fixation and embedding in the Epon resin. E: As D after trimming the block face. F: EM overview image highlighting the area containing the cell of interest. G: Zoomed image of the overlay of the DIC and fluorescence of the cell of interest. Arrow points to the organelle containing EGF-biotin coupled to streptavidin-QD 655 (image G to J) H: EM image of the same region as G. I: Overlay of the fluorescence image and the electron micrograph of the same region as G. J: Electron micrograph of the subcellular area containing the organelle of interest. K: Standard high magnification bright field EM image of the organelle of interest. L: Screen shot of the modeling part of an electron tomography experiment where structures of interest have to be manually segmented. M: Screen shot of the modeling of the structure of interest. N: HAADF image of the same region as K.

