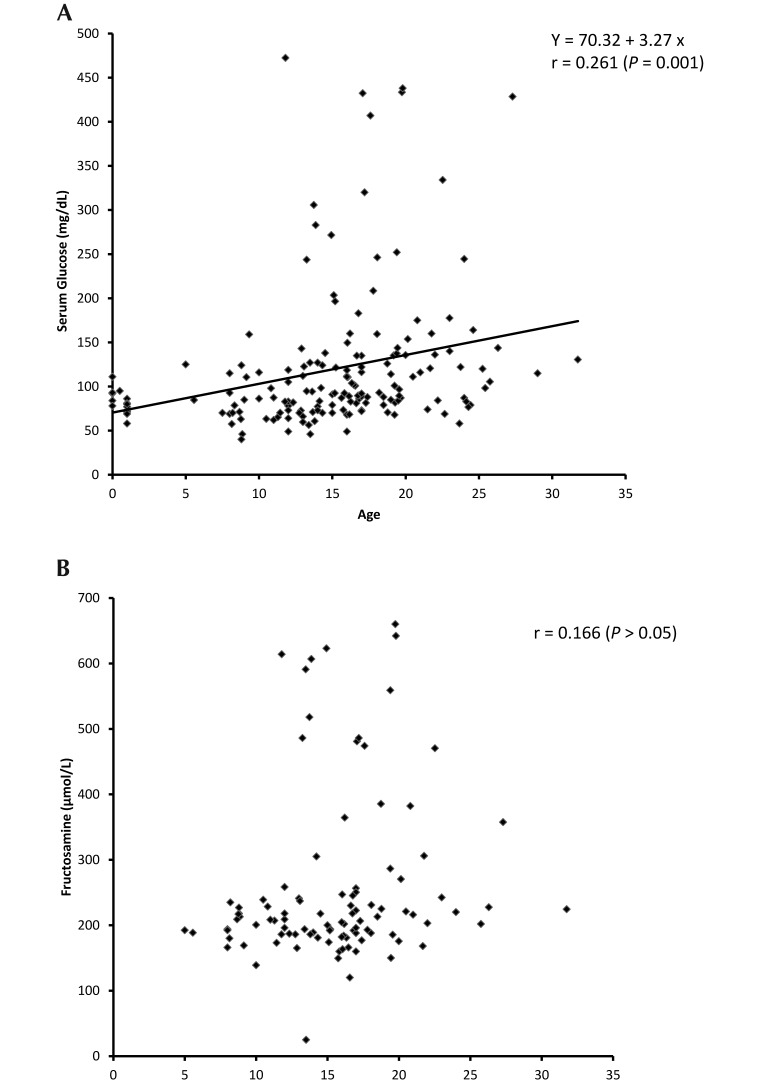
Figure 8.
(A) Pearson product-moment correlation was used to compare serum glucose measurements (in mg/dL) with age (in y). The solid line represents the linear correlation. Pearson correlation, r = 0.261 (P = 0.001). (B) Pearson product-moment correlation was used to compare fructosamine (in µmol/L) with age (in y). There was no significant linear correlation (Pearson correlation, r = 0.166 [P > 0.05]).

