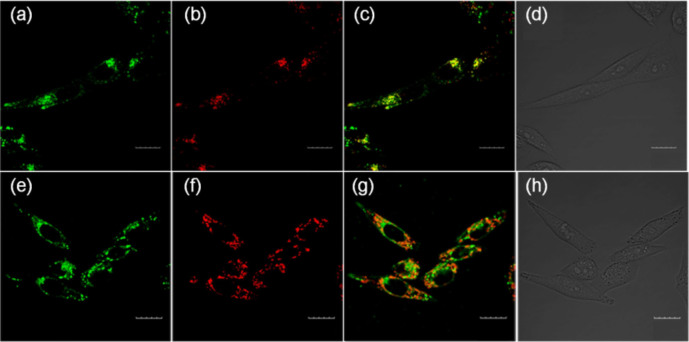
Figure 3. Fluorescence co-localization imaging of MCF-7 cells stained with 3.0 μM 1 and 3.0 μM NR for 3 min at 37°C (a–d) or 3 μM MitoTracker TMRM for 3 min at 37°C (e–h).
(a) Image from 1. λex = 405 nm, λem = 530–570 nm; (b) image from NR. λex = 559 nm, λem = 580–610 nm; (c) merged image; (d) bright-field image; (e) image from 1. λex = 405 nm, λem = 530–570 nm; (f) image from MitoTracker TMRM. λex = 559 nm, λem = 570–610 nm; (g) merged image; (h) bright-field image. Scale bars = 20 μm.

