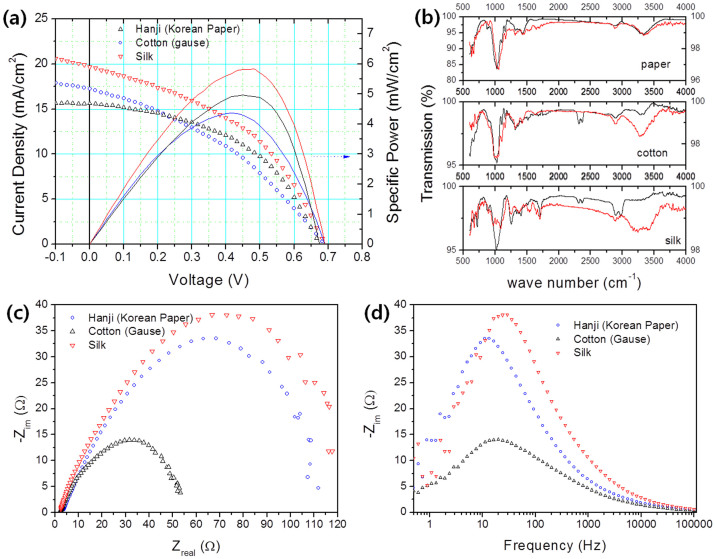
Figure 4.
(a) Relationship between current density, specific power, and applied voltage according to the cloth used: Hanji (blue circle), cotton gauze (black triangle), and silk gauze (red triangle). (b) Fourier-transform infrared (FTIR) spectra of Hanji, cotton gauze, and silk gauze before (black line) and after (red line) soaking in the electrolyte for one day. (c) Nyquist plot and (d) Bode plot of textile-based DSSCs using Hanji, cotton gauze, and silk gauze under open-circuit conditions and 1-Sun, 1.5-AM illumination.

