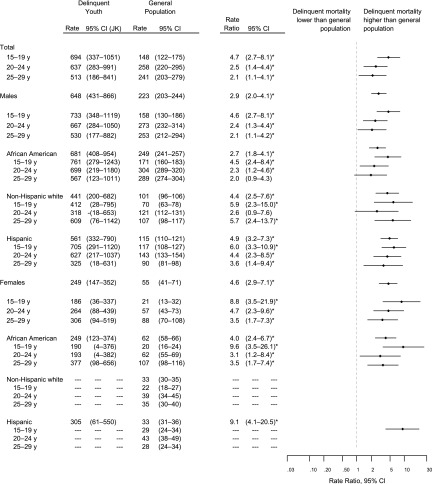
FIGURE 1.
Standardized all-cause mortality rates of delinquent youth after detention (N = 1829) compared with the general population. Rates for delinquent youth are given in deaths per 100 000 person-years; rates for the general population are given in deaths per 100 000 person-years in Cook County, 2005. We do not report racial/ethnic or age specific rates for groups with ≤3 deaths in our sample. Crude mortality rates across racial/ethnic categories were weighted to reflect the racial/ethnic distribution of the CCJTDC. *Indicates a statistically significant difference in mortality rates (P < .05).

