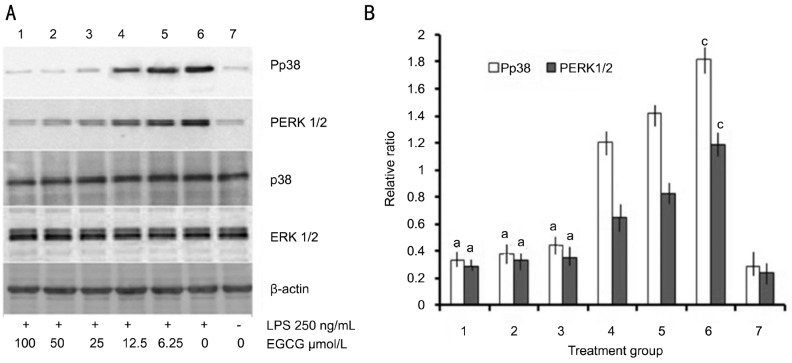
Figure 2. Effect of EGCG on LPS-induced P38 and ERK1/2 activation in HRECs.
A: Cells were pre-treated with indicated concentrations of EGCG in the presence or absence of LPS (250 ng/mL). Whole cell lysates were prepared and probed for total and phospho-p38 and ERK1/2 by western blotting. β-actin was used as a loading control; B: The levels of P38 and ERK1/2 phosphorylation were quantified by densitometric analysis, and Pp38 or PERK1/2 data were expressed as the relative ratio of the corresponding value phospho-p38/p38 or phosphor-ERK1/2/ERK1/2 of each group with the correction of β-actin (mean±SEM, n=3/group). aP<0.05 vs group 6, cP<0.05 vs group 7.

