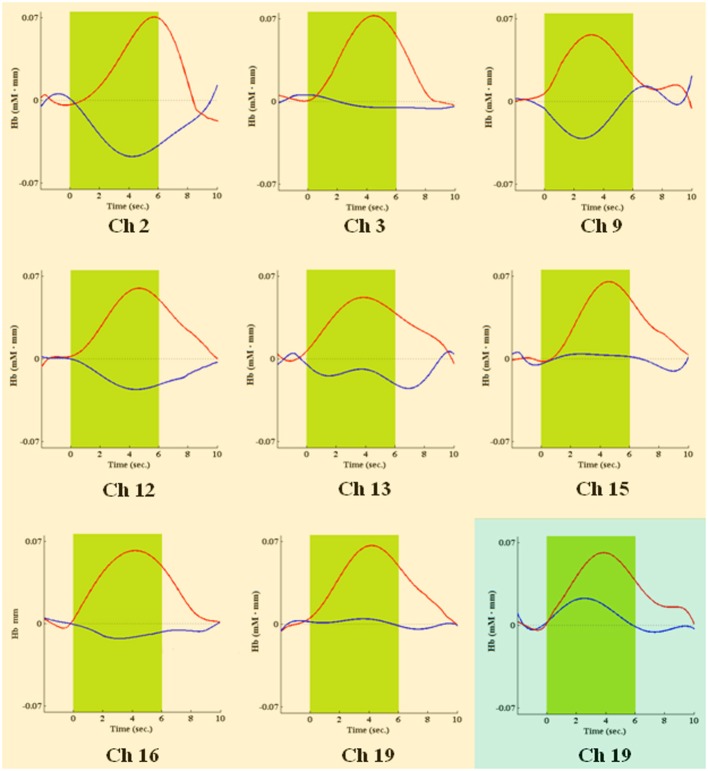
Figure 6.
Time courses of HbO2 (in red) and deoxy-hemoglobin (in blue) concentration changes, reported in mM•mm, in channels found significantly activated during the second IGT period, in association with high risk choices (pink background) or low risk choices (green background). The green area shows when the green slide was presented on a computer screen to participants, signaling that the choice could be made.

