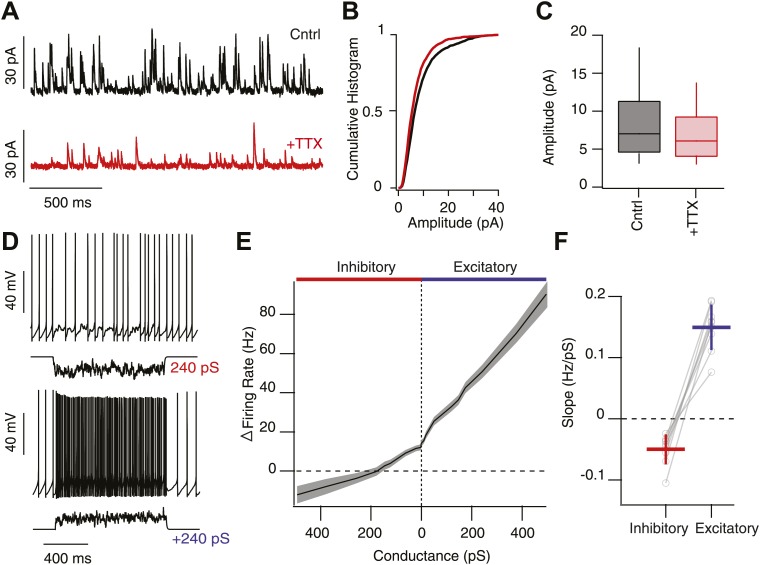
Figure 4. High background inhibition has little affect on tonic activity of SNr neurons.
(A) Whole-cell recording of spontaneous IPSCs (sIPSCs) onto SNr neurons in control conditions (Cntrl; black trace) and following addition of tetrodotoxin (TTX) to isolate miniature events (+TTX; red trace, Vh 0 mV). (B) Cumulative histogram of IPSC amplitude in control conditions and following addition of TTX (n = 4 cells). (C) Box and whisker plot of IPSC amplitude for control and following addition of TTX. (D) Spiking output of SNr neurons following addition of high background excitation (upper) or inhibition (lower) via the dynamic clamp. (E) Summary data of change in firing rate of SNr neurons (n = 11 cells) following an increasing the relative frequency of inhibitory (red) or excitatory conductances (blue). (F) The slope of the change in firing rate as a function of change in conductance was significantly greater following increases in excitatory conductance compared to inhibitory conductance.


