. 2014 May 21;3:e02397. doi: 10.7554/eLife.02397

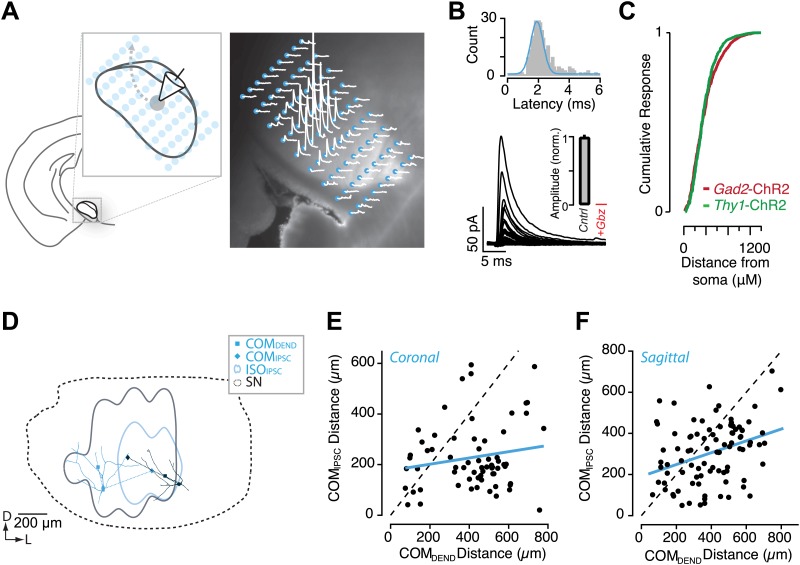
Figure 6. Circuit mapping of feedback inhibitory circuitry of SNr.

(A, left) Schematic of the experimental configuration used for channelrhodopsin-assisted circuit mapping. Whole-cell voltage clamp recordings were obtained from SNr GABA neurons while a focus laser beam was scanned across the SNr to excite SNr neurons with high spatial resolution. (A, right) Postsynaptic responses to individual photostimulations (white) were aligned to the DIC image of the slice. Stimulation points are indicated by cyan. (B) Example of evoked IPSCs from a single recording with a histogram of IPSC latencies for all recordings. Evoked IPSCs were completely inhibited in the presence of Gbz (B, insert; n = 8 cells; p<0.001, paired two tailed t test). (C) Cumulative histogram of response magnitude as a function of the distance between the stimulation site and recorded neuron in the Thy1-ChR2 (green) and Gad2-ChR2 (maroon) preparations. (D) Example of IPSC maps for two neurons. The dendritic arbor of each recorded neuron was reconstructed and transformed into the common SN reference frame (dotted line). For each neuron the center of mass (COM) of inhibition (COMIPSC, filled diamond), COM of dendritic field (COMDEND, filled square) and the isocontour of 50% inhibition (IS0IPSC, colored line) were calculated. (E and F) The COMIPSC was plotted as a function of the COMDEND for each neuron recorded in coronal (E; n = 14 cells) and sagittal (F; n = 16 cells) sections and the correlation fit estimated (blue line).

DOI: http://dx.doi.org/10.7554/eLife.02397.013

Figure 6.

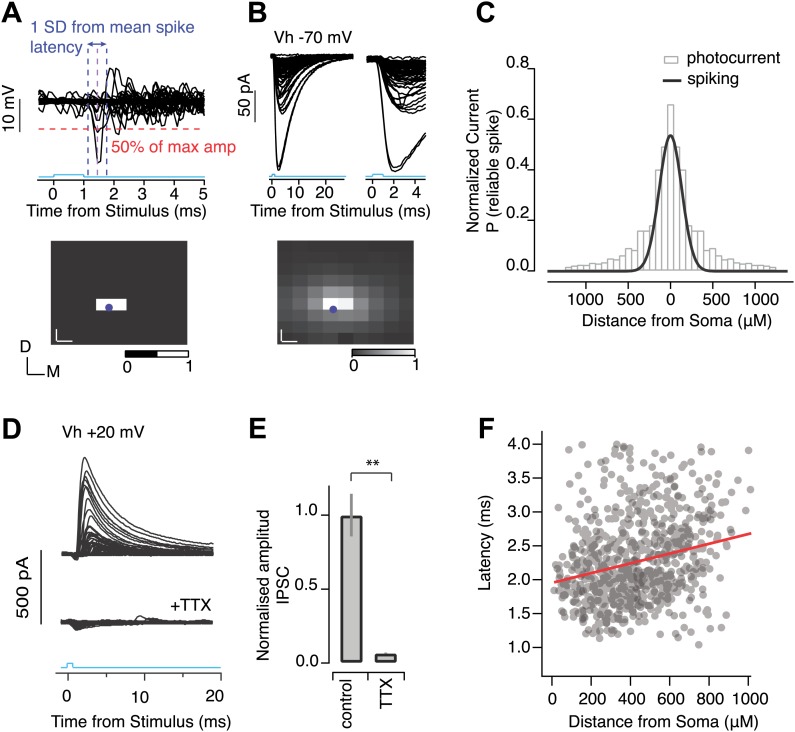
Figure 6—figure supplement 1. Light-evoked IPSCs result from perisomatic spiking.

Figure 6—figure supplement 1.

Calibration experiments were carried out to determine the resolution of photostimulation evoked spiking in individual SNr neurons in Thy1-ChR2 mice. (A) Cell-attached recordings from individual SNr neurons were made while a focused laser beam was scanned throughout a pre-defined grid of stimulation points spanning the SNr (‘Materials and methods’). SNr neurons are tonically active, firing at ∼10–40 Hz, thus to access which stimulation point evoked reliable spiking, spike traces were averaged over multiple (>3) trials, and voltage responses surrounding stimulation points were superimposed (A, upper). Voltage deflections which exceeded 50% of the maximum amplitude, and which fell within 1 standard deviation (1 SD) of the mean spike latency, were counted as generating reliable spiking. From this a corresponding color map of spiking reliability (scale bar, 0 = not reliable spiking, and 1 = reliable spiking) was generated (A, lower). (B) Whole cell recordings were then made from the same neuron to access photocurrent amplitude at each stimulation point using the same grid as in A. Cells were held at −70 mV to isolate ChR2 mediated photocurrent. Averaged photocurrents evoked at each stimulation point were superimposed (B, upper left) and shown with an expanded time scale (B, upper right) and as a corresponding color map of normalized peak amplitudes (B, right; scale bar, 0 = min amplitude, and 1 = max amplitude). For color maps in A and B blue dot indicates cell soma position, white scale bar represents distance between stimulation point. (C) The binned, normalized mean photocurrent response as a function of distance away from the soma (gray bars) and a fit to the binned probability of reliable spiking over the same distance for SNr GABA neurons (solid black line, n = 4 cells). All recordings were performed in the presence of synaptic transmission blockers. To test whether suprathreshold axonal stimulation of SNr collaterals could evoke synaptic transmission, SNr GABA neurons were voltage-clamped at Vh + 20 mV to isolate IPSCs. Focused photostimulation throughout the SNr evoked IPSCs under control conditions (D, upper) and these were completely blocked following the addition of TTX (D, lower). (E) Population data showing TTX inhibition of IPSCs (E, n = 5 cells, p<0.001; paired two-tailed t test). (F) For a subset of mapping experiments, the latency to the detected IPSC is plotted as a function of distance from soma of the stimulation site. Although the spread is rather large due to variations in latency of evoked spikes by ChR2 positive SNr neurons, there is significant slope towards added propagation delays of ∼0.5 ms per 1 mm of stimulation distance. This corresponds to roughly 2 m/s conduction velocities, which is comparable to previously obtained estimates (1.7 m/s) in rats (Deniau et al., 1978).