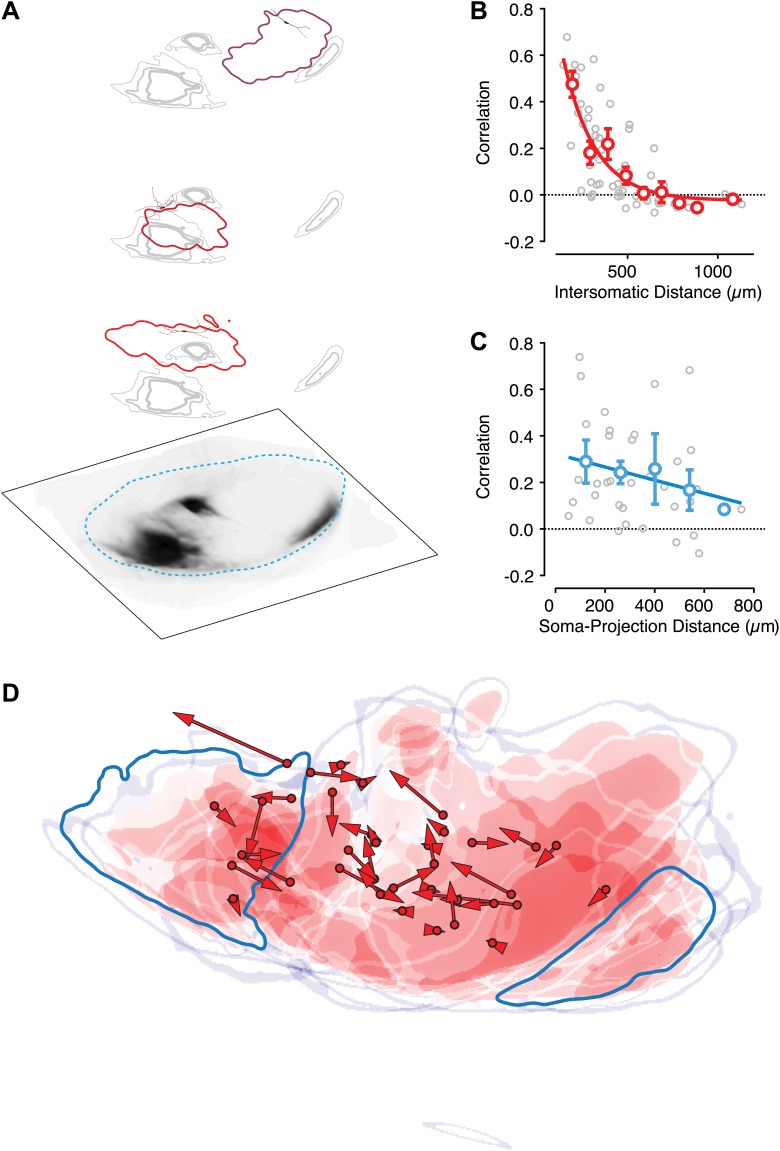
Figure 7. Intranigral inhibition is poorly predicted by the organization of the striatonigral pathway.
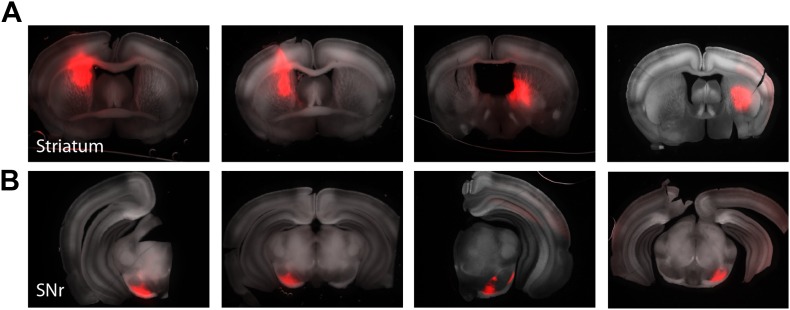
Neurons in the dorsal striatum of Drd1a-cre x Thy1-ChR2 double transgenic mice were infected with cre-dependent AAV that drove the expression of a red fluorescent protein to label striatonigral axons (tdTomato). Bright-field images of the fluorescent axons in the SN were used to estimate the location of labeled axons (A, bottom layer). Estimates of the density of axonal labeling were produced by extracting the axon contour (quartiles indicated by gray line thickness) and compared with the localization of local inhibitory input (thresholded at 20% of maximum response) for multiple neurons recorded in the same slice (A, upper 3 layers). Individual postsynaptic neurons with proximal dendritic arbors reconstructed are shown in shades of red. The approximate border of the SN is indicated (cyan dashed line). (B) The correlation in spatial maps of IPSC amplitudes were computed for all pairwise comparisons between neurons recorded in the same slice (n = 10 slices; n = 36 cells) as a function of the distance between somata. Gray circles are individual correlations, red circles are binned means with standard errors, and solid red line is an exponential fit. (C) For each slice the correlation between a spatial map of IPSC amplitudes and the axonal density map is shown as a function of the distance between the soma of the recorded neuron and the center of mass of the axon projection. (D) For all slices the maximum intensity contrast (‘Materials and methods’) for the axonal labeling was overlaid with the location of all recorded somata (red circles). The angle and distance to the center of mass of the spatial maps of IPSC amplitudes are indicated by the red arrows. An example projection field from a single infection of the dorso-medial striatum is shown in dark cyan.


