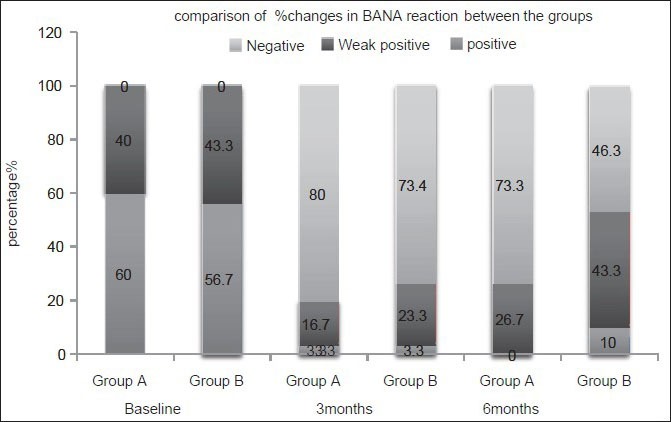
Figure 1.

Analysis and comparison of the percentage changes in N-benzoyl-DL-arginine-b-naphthylamide test between the groups at different time points

Analysis and comparison of the percentage changes in N-benzoyl-DL-arginine-b-naphthylamide test between the groups at different time points