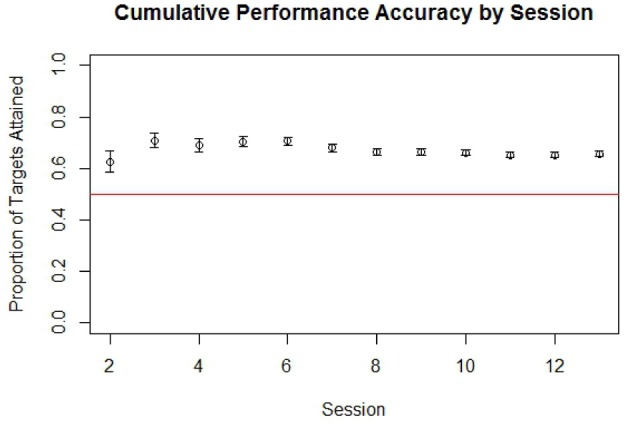
Figure 4.

Cumulative performance accuracy in targets attained by run for all completed non-adaptive runs of BCI cursor task game play grouped by session. The red line in is drawn at 0.5, which represents the level at which half of targets presented within a run would be attained by chance. Error bars represent the standard error.
