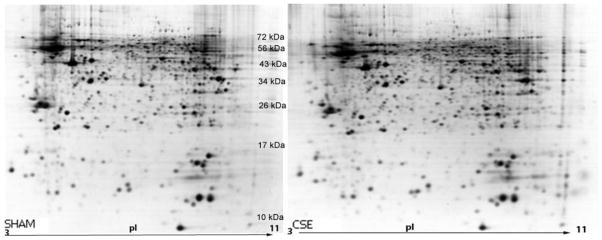
Figure 1. Representative 2D-SDS-PAGE gels of the urea-soluble hippocampus proteins from SHAM and CSE offspring.

The figure depicts a side-by-side comparison of protein spot separations based on isoelectric focusing point (horizontal) and molecular weight (vertical) in the two experimental groups (SHAM-left; CSE-right). The gels are similar in number of spots without the appearance or loss of spots between groups. The contrast of these images has been uniformly altered to accentuate low abundant protein spots. Subsequent analyses of protein spot alterations between the groups were based on unaltered contrast images.
