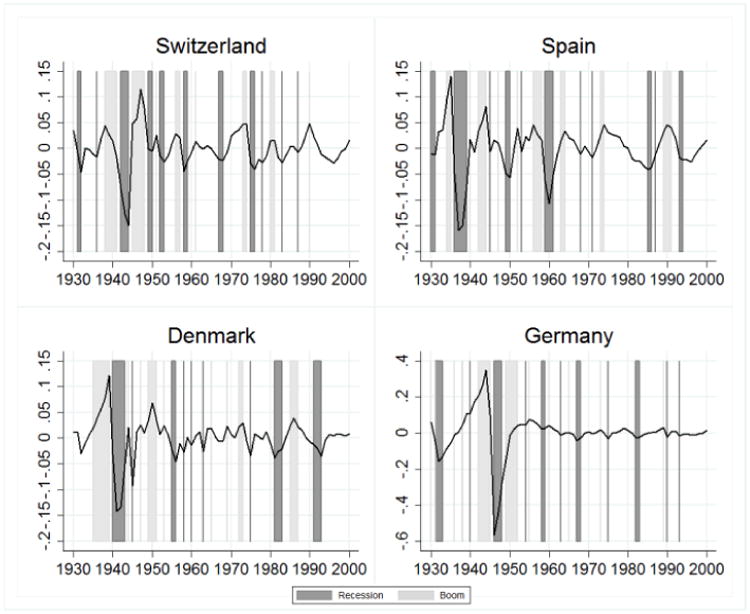
Booms and Recessions in Four European Countries (1930-2003)a.

aThe Figure shows annual deviations from the smoothed trend of (log) GDP per capita for four representative countries (Germany, Denmark, Spain and Switzerland) for the years 1930 to 2003 as well as the years in which there was a recession or a boom, defined as deviations from the trend falling in the lowest or highest country-specific quartile respectively. A positive deviation indicates a cyclical upturn and a negative deviation a cyclical downturn. In addition to the annual deviations from the smoothed trend, the light-grey shaded areas show if there was a boom and the dark-grey shaded bars show if there was a recession in a specific year. As the deviations from the smoothed trend highlight, in all four countries there are marked fluctuations in the development of (log) GDP per capita over this time-period, thus making it possible to identify booms and recessions from the data.
