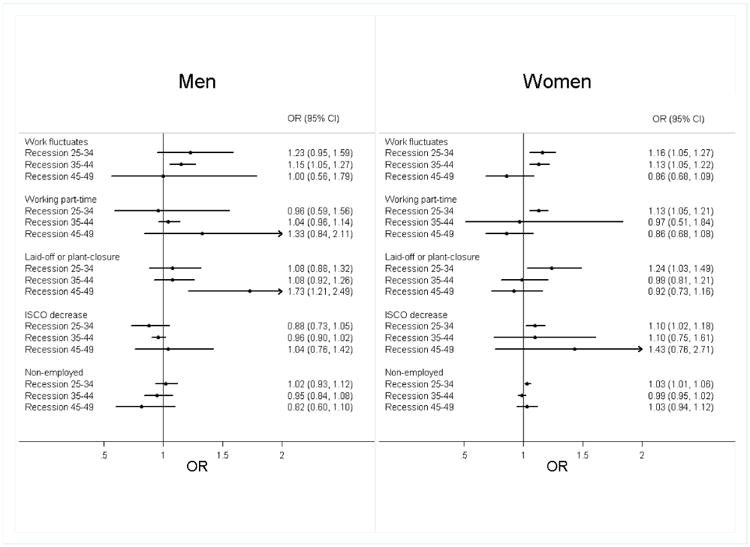
Figure 2. Associations of Recessions With Working Conditions (Occupational Class Mobility and Working Conditions)a.

aAbbreviations: OR, odds ratio; 95% CI, 95% confidence interval of double-sided test; P, p-value; ISCO, International Standard Classification of Occupations.
The graphs show the odds ratios of one recession experienced at each age interval on experiencing a respective working condition in this age interval for men and women, after adjusting for all confounders. Odds ratios on the right side of the vertical line indicate increased likelihood to have experienced one of the five working conditions. All models were run separately for each type of working condition and age-interval and include the same individual-level covariates as in Table 1 as well as dummies for the country of residence (coefficients not shown).
