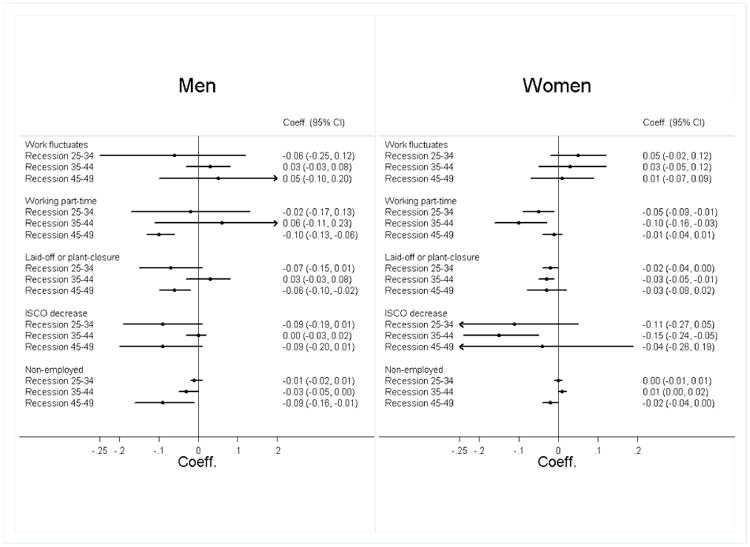
Figure 3. Associations of Working Conditions and Cognitive Function for Men and Women at Three Age Intervals a.

aAbbreviations: Coeff., regression coefficient; 95% CI, 95% confidence interval of double-sided test; P, p-value; ISCO, International Standard Classification of Occupations. The graphs show the regression coefficients associated with experiencing a respective working condition in this age-interval and cognitive functioning after adjusting for all confounders. All models were run separately for each type of working condition and age-interval and include the same individual-level covariates as in Table 1 as well as dummies for the country of residence (coefficients not shown).
