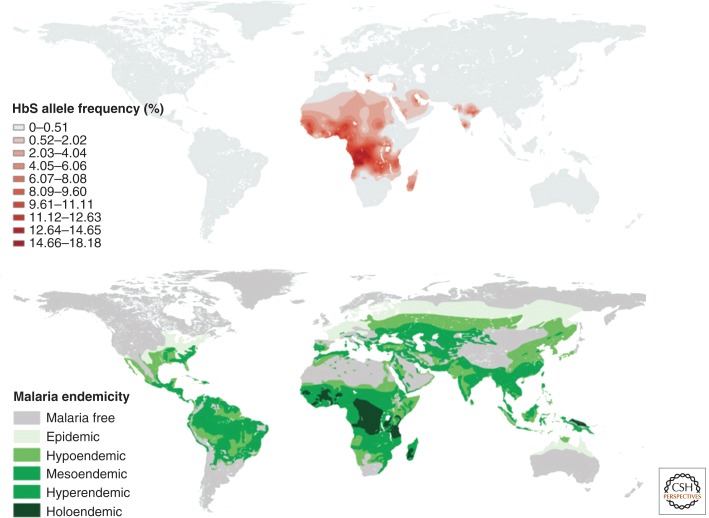
Figure 4.
Global distribution of the HbS sickle cell anemia allele compared to the historic geographic distribution of malaria. (Top) Global distribution of HbS allele frequency predicted from Bayesian geostatistical modeling. (Bottom) Historical map of malaria endemicity. The classes are defined by PfPr2−10 (PfPr2−10 = proportion of 2- to 10-year olds with confirmed blood stage asexual parasites): malaria free, PfPr2−10 = 0; epidemic, PfPr2−10 ≈ 0; hypoendemic, PfPr2−10 < 0.10; mesoendemic, PfPr2−10 ≥ 0.10 and < 0.50; hyperendemic, PfPr2−10 ≥ 0.50 and < 0.75; holoendemic, PfPr0−1 − 1 ≥ 0.75 (this class was measured in children ages 0–1) (From Piel et al. (2010); reproduced, with express permission, from Nature Publishing Group © 2010.)

