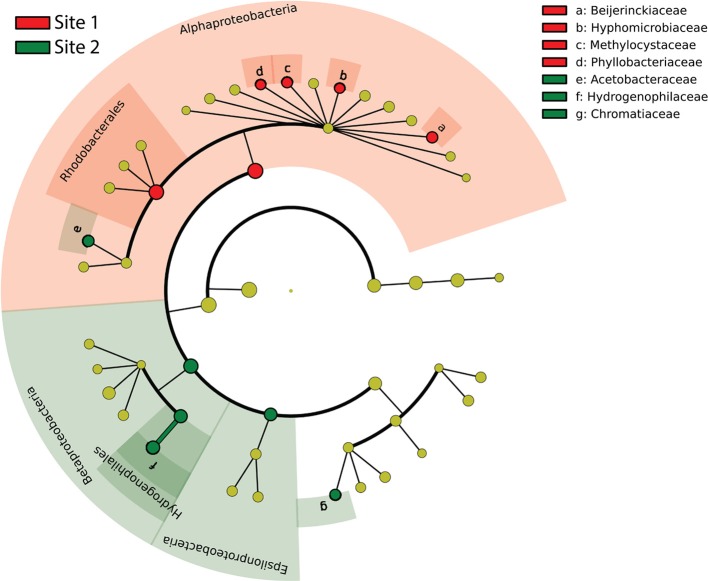
Figure 6.
Cladogram indicating the taxonomic distribution of potential S-oxidizer lineages statistically different between sampling sites, based on 16S rRNA amplicon sequence data. Lineages with LDA 2.0 or higher determined by LEfSe are displayed. Red circles and shading indicate lineages enriched at Site 1; green circles and shading indicate lineages enriched at Site 2. Yellow circles denote non-significantly different lineages.

