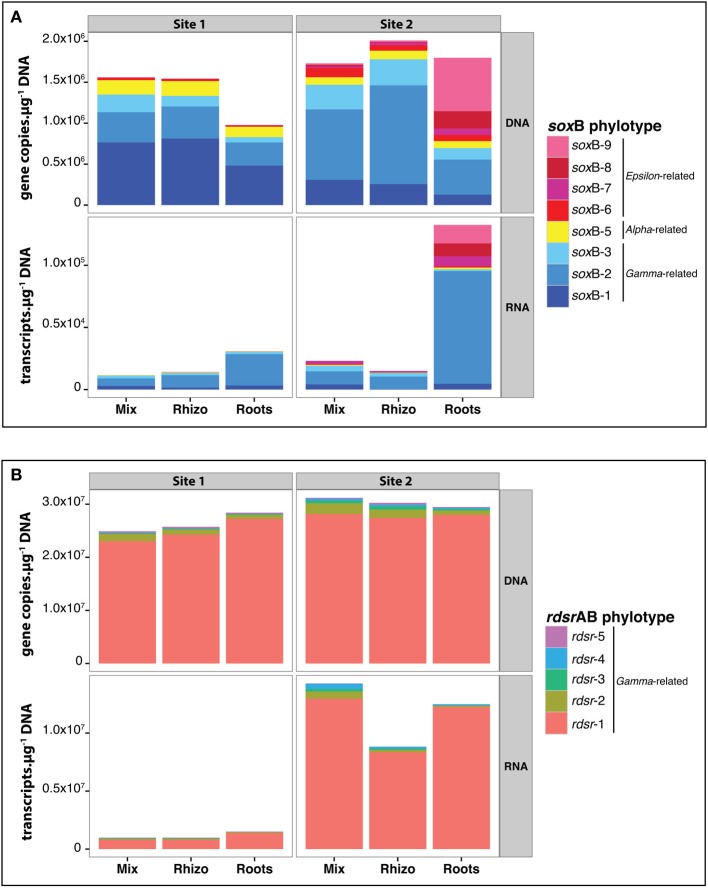
Figure 7.
Variations in gene and transcript abundance for soxB (A) and rdsrAB phylotypes (B) for samples at 5 cm depth from the two sites in October. Values are mean copy numbers (n = 3). Copy numbers were calculated using standard curves and efficiencies reported in Table Supp2. Details (including standard errors) for each phylotype are given in Figures Supp2–Supp5.

