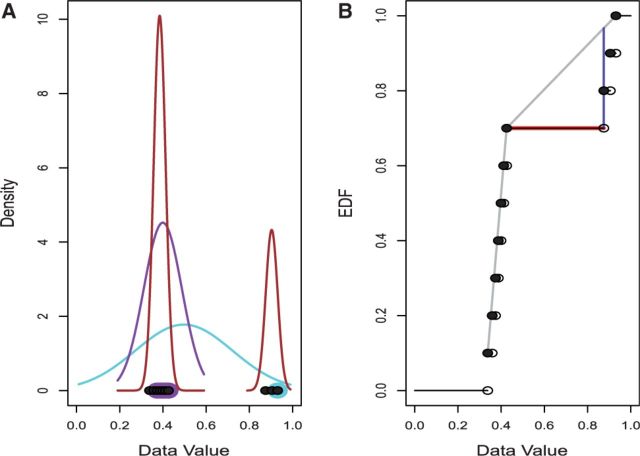
Fig. 1.
OASIS Methods. (A) The LOO, LMS and SIBER methods. The x-coordinates of the points at the bottom show the observed data values. LOO leaves out one point (highlighted in light blue) and then fits a normal distribution to the remaining points (light blue curve). The value of the left-out observation is compared to the normal distribution obtained by leaving it out. LOO repeats this process for every observation. LMS identifies the narrowest interval that covers 50% of the observations (shown by the points highlighted in purple) and determines the normal distribution with central 50% that matches this interval (shown by the purple curve). LMS then compares all points to this normal distribution. SIBER fits two component mixtures of normal distributions (shown in brown) and then calculates distance between in a form of a BI. (B) The maximum spacing test (MAST) and DT methods. The black points show the observed data values (x-coordinate value) and their EDF (y-coordinate value). MAST determines the largest difference between consecutive ordered data values (shown by the red line) and compares its value to the distribution of the largest difference between consecutive ordered independent uniform(0,1) observations (data not shown). DT determines the cumulative distribution function of the best fitting non-parametric unimodal distribution (shown by the gray curve) and then determines the largest difference between the fitted curve and the EDF (shown by the dark blue line)

