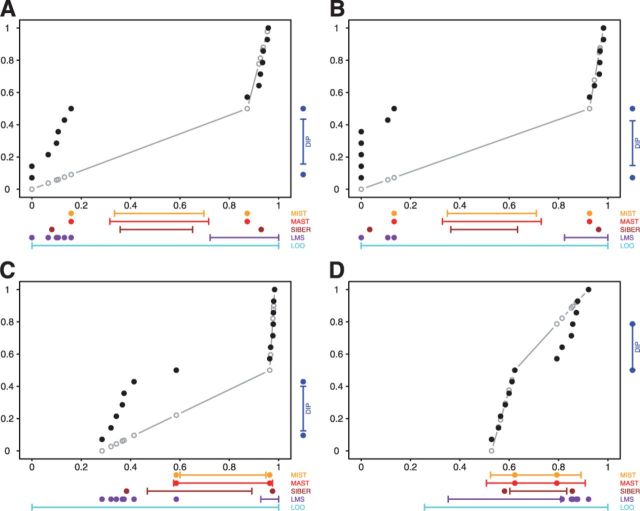
Fig. 2.
GLIS2 OASIS results for (A) RNA-seq exon read-count data, (B) RNA-seq junction read-count data, (C) exon array exon expression data and (D) exon array gene expression data. Each panel shows the results of DIP, MIST, MAST, SIBER, LMS and LOO for the indicated form of data. The DIP results are indicated by the vertical bar and two points in the right margin of the plot. The two dots indicate the vertical positions that define the dip statistic, the maximum vertical distance between the EDF (step function defined by black dots) and the best-fitting UDF (shown by the gray curve). The length of the bar corresponds to the value of the dip statistic that has  so that significance at the
  level is indicated by the dots falling beyond the endpoints of the bar. The results of MIST, MAST, SIBER, LMS and LOO are shown in the bottom margin. For each of these methods, the length of the bar indicates the distance between the two points that defines significance at the
  level. For MIST and MAST the two points correspond to the data values that define the spacing of interest. For SIBER, the points correspond to the estimated means of the two-component mixture model. The results of LMS and LOO are shown by 99% intervals and points falling outside those intervals were identified as outliers

