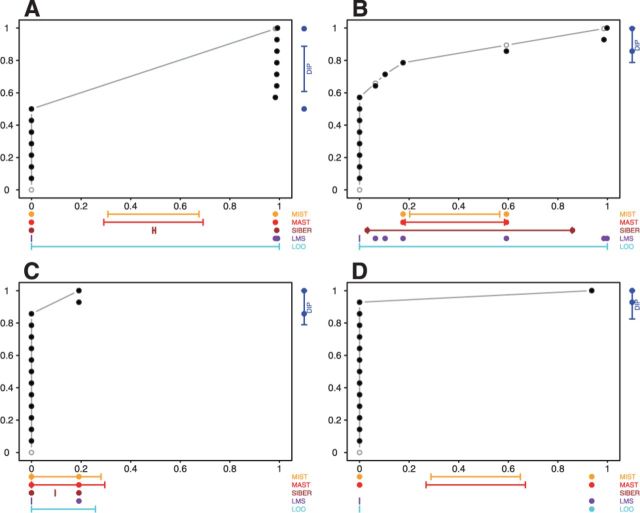
Fig. 3.
Most significant RNA-seq exon by each OASIS method. (A) The data for the top hit according to DIP, LMS–SST, MAST and MIST; (B) The data for the top hit according to LMS–MOP. (C) The data for the top hit according to SIBER. (D) The data for the top hit according to LOO–MOP and LOO–SST. There is no result for SIBER in (D) since it is impossible to estimate variance of one data point (one data point on the right top corner)

