Fig. 8.

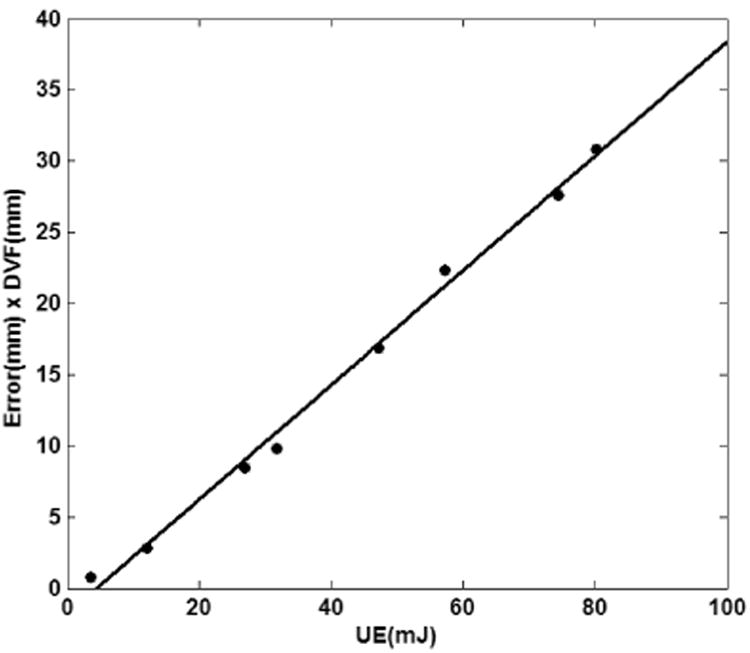
The relation between the UE and Error×DVF for the landmark datasets of the eight phases for the POPI-model. Each dot represents the averages of UE and Error × DVF over 41 landmarks in each phase.

The relation between the UE and Error×DVF for the landmark datasets of the eight phases for the POPI-model. Each dot represents the averages of UE and Error × DVF over 41 landmarks in each phase.