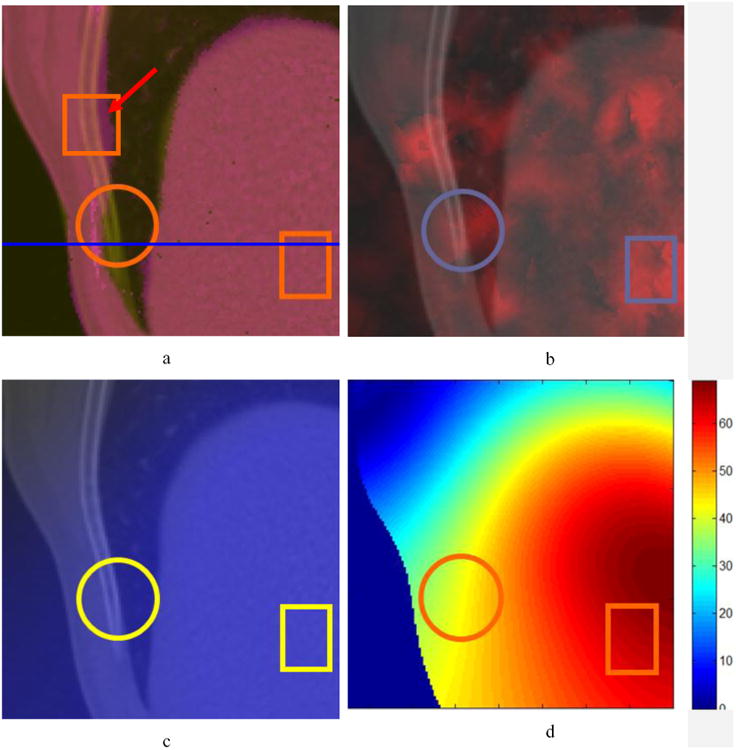
Fig. 9.

The fixed image map overlaid by (a) the registered image; (b) the UE image; (c) the IC image; (d) the magnitude image of DVF. Circle regions show areas of anatomical mismatch in (a) while rectangular regions demonstrate that UE is able to detect DIR errors in uniform intensity regions in (b). The profile of the line in (a) is plotted in Fig. 10.
