
Figure 2.
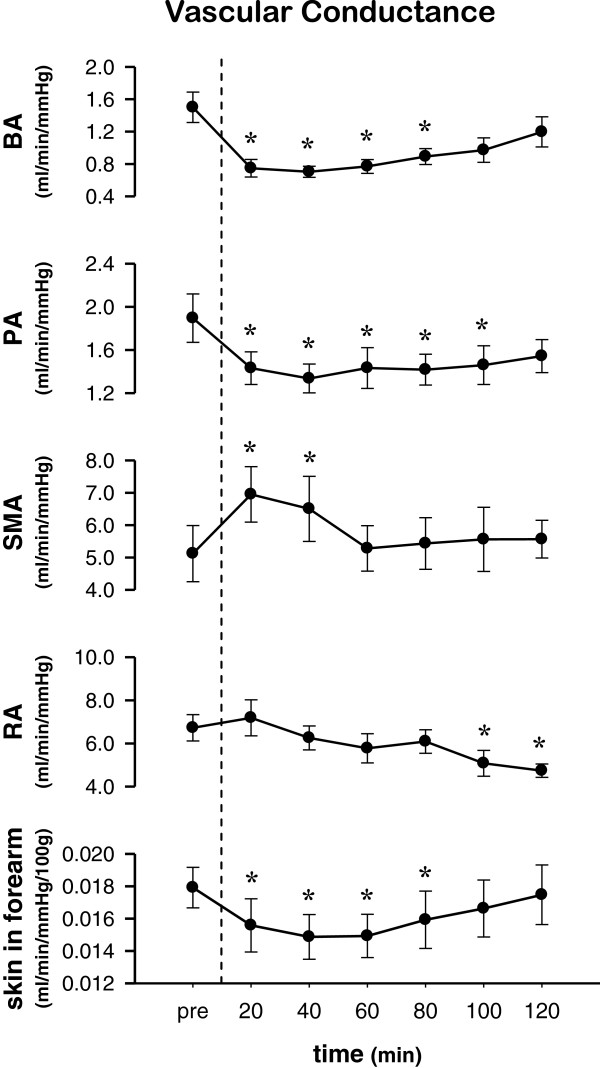
Change in regional vascular conductance (VC) before and after ingestion of fructose. Changes in VC in the brachial artery (BA), popliteal artery (PA), superior mesenteric artery (SMA), right renal artery (RA), and forearm skin are shown from the top. Data: mean ± SEM*: versus pre-ingestion (P <0.05).