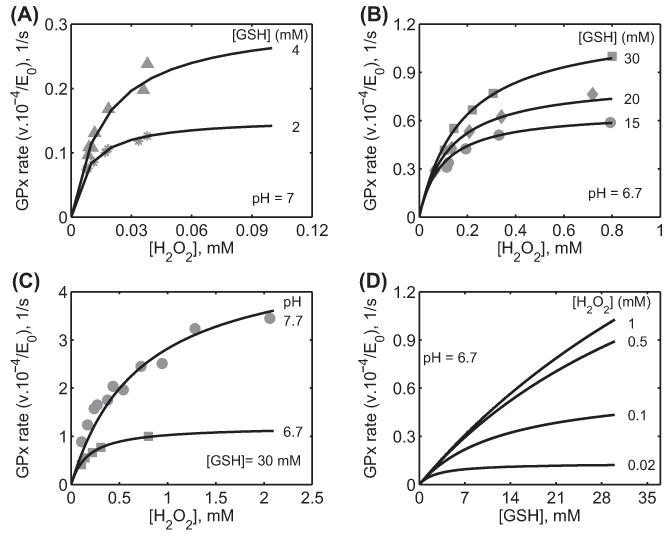
Figure 2.
Characterization of the initial velocity data of GPx-1 for Flohé et al. [26] from bovine erythrocytes. Here, the enzyme assays were carried out at 0.15 M ionic strength and 37 °C. (A) Model fits to the initial velocity data with varying [H2O2] for two different [GSH] (2 and 4 mM) at pH 7 using phosphate buffer. (B) Model fits to the initial velocity data with varying [H2O2] for three different [GSH] (15, 20, and 30 mM) at pH 6.7 using MOPS buffer. (C) Model fits to the initial velocity data with varying [H2O2] for a fixed [GSH] (30 mM) and for different pH (6.7 and 7.7) using MOPS buffer. (D) Model simulation of initial velocity data with varying GSH for four different fixed [H2O2] (0.02, 0.1, 0.5, and 1 mM) at pH 6.7 under MOPS buffer conditions.

